Python|使用 folium 包向火山位置添加标记
Python是一种多用途语言,它的实用程序不仅限于普通编程。它可用于开发游戏、爬网或开发深度学习模型。
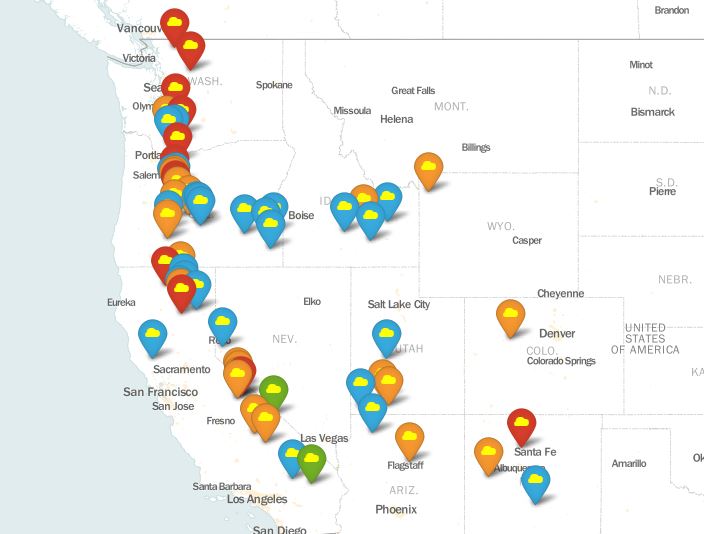
我们将使用名为folium (与 Pandas)的Python库以及Volcanoes_USA数据集(其中包含本项目中使用的必要数据)。该脚本将创建一个保存的网页。打开它后,用户将被引导到谷歌地图,其中将标记火山的位置,并根据海拔设置它们的颜色。
设置:
首先,安装 folium、pandas 等库和上面提到的数据集:
pip3 install folium
pip3 install pandas
现在,您需要下载所需的数据集 Volcanoes_USA.txt。请记住将其下载到您将保存Python脚本的同一目录中。此外,请务必从数据集中“NAME”列的值中删除撇号“'”,只要存在。
预定义功能:
- Mean() – 一个 pandas函数,可以计算数组/系列中的值的平均值。
- Map() – 使用默认图块集或自定义图块集 URL 生成给定宽度和高度的基本地图。
- Marker() – 在地图上创建一个简单的股票传单标记,带有可选的弹出文本或文森特可视化。
用户定义功能:
- color() - 用于根据火山的高度为标记分配颜色。
下面是实现:
Python3
#import the necessary packages
import folium
import pandas as pd

# importing the dataset as a csv file,
# and storing it as a dataframe in 'df'
df=pd.read_csv('Volcanoes.txt')

# calculating the mean of the latitudes
# and longitudes of the locations of volcanoes
latmean=df['LAT'].mean()
lonmean=df['LON'].mean()

# Creating a map object using Map() function.
# Location parameter takes latitudes and
# longitudes as starting location.
# (Map will be centered at those co-ordinates)
map5 = folium.Map(location=[latmean,lonmean],
        zoom_start=6,tiles = 'Mapbox bright')

# Function to change the marker color
# according to the elevation of volcano
def color(elev):
    if elev in range(0,1000):
        col = 'green'
    elif elev in range(1001,1999):
        col = 'blue'
    elif elev in range(2000,2999):
        col = 'orange'
    else:
        col='red'
    return col

# Iterating over the LAT,LON,NAME and
# ELEV columns simultaneously using zip()
for lat,lan,name,elev in zip(df['LAT'],df['LON'],df['NAME'],df['ELEV']):
    # Marker() takes location coordinates
    # as a list as an argument
    folium.Marker(location=[lat,lan],popup = name,
                  icon= folium.Icon(color=color(elev),
                  icon_color='yellow',icon = 'cloud')).add_to(map5)

# Save the file created above
print(map5.save('test7.html'))
输出:

参考:
http://python-visualization.github.io/folium/docs-v0.5.0/modules.html