在Python使用 Folium 可视化地理空间数据
对于处理国家、城市等数据集的人来说,最重要的任务之一是了解其数据的物理位置与其地理环境之间的关系。一种可视化数据的方法是使用Folium 。
Folium 是一个强大的Python数据可视化库,主要用于帮助人们可视化地理空间数据。使用 Folium,您可以创建世界上任何位置的地图。 Folium 实际上是leaflet.js 的Python包装器,它是一个用于绘制交互式地图的javascript 库。
我们现在将看到一种绘制和可视化地理空间数据的简单方法。我们将使用由美国失业率组成的数据集
安装
如果未安装 folium,则可以使用以下任一命令简单地安装它:
$ pip install folium

OR

$ conda install -c conda-forge folium
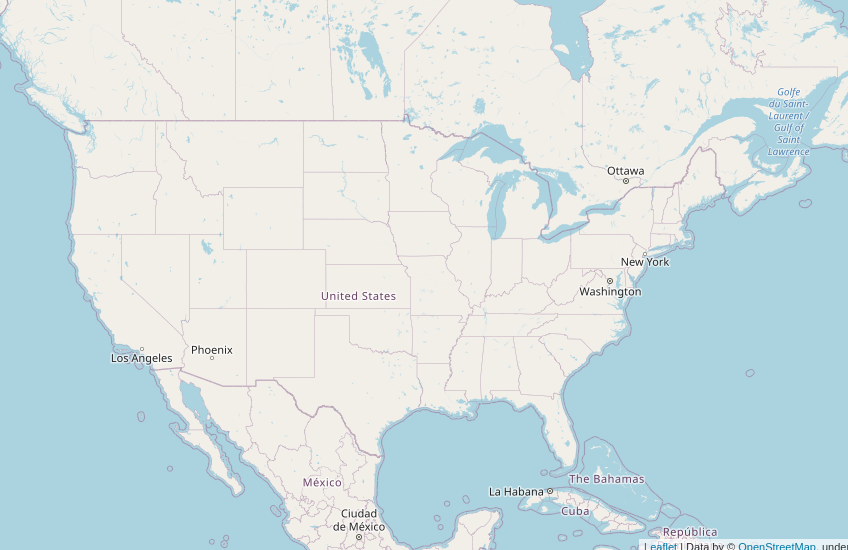
使用 folium.Map(),我们将创建一个基本地图并将其存储在一个对象中。此函数将位置坐标和缩放值作为参数。
Syntax: folium.Map(location,tiles= “OpenStreetMap” zoom_start=4)
Parameters:
- location: list of location coordinates
- tiles: default is OpenStreetMap. Other options: tamen Terrain, Stamen Toner, Mapbox Bright etc.
- zoom_start: int
代码:
Python3
# import the folium, pandas libraries
import folium
import pandas as pd

# initialize the map and store it in a m object
m = folium.Map(location = [40, -95],
               zoom_start = 4)

# show the map
m.save('my_map.html')
Python3
# getting the data
url = (
    "https://raw.githubusercontent.com/python-visualization/folium/master/examples/data"
)
state_geo = f"{url}/us-states.json"
state_unemployment = f"{url}/US_Unemployment_Oct2012.csv"
state_data = pd.read_csv(state_unemployment)
Python3
folium.Choropleth(

      # geographical locations
    geo_data = state_geo,
    name = "choropleth",

      # the data set we are using
    data = state_data,
    columns = ["State", "Unemployment"],

      # YlGn refers to yellow and green
    fill_color = "YlGn",
    fill_opacity = 0.7,
    line_opacity = .1,
      key_on = "feature.id",
    legend_name = "Unemployment Rate (%)",
).add_to(m)

m.save('final_map.html')
输出:

使用熊猫导入数据集:
现在,我们将使用 Pandas 库导入数据集。
蟒蛇3
# getting the data
url = (
    "https://raw.githubusercontent.com/python-visualization/folium/master/examples/data"
)
state_geo = f"{url}/us-states.json"
state_unemployment = f"{url}/US_Unemployment_Oct2012.csv"
state_data = pd.read_csv(state_unemployment)
使用数据集创建地图:
一旦我们拥有了所有数据,我们将使用等值线图来可视化这些数据。 Chloropleth 地图根据呈现给他们的统计变量以各种颜色表示划分的区域。在这里,我们使用美国的失业率作为将地区划分为不同颜色的一种手段。
使用folium.Choropleth() ,我们可以绘制最终地图。每个属性的详细信息在代码本身中给出。 ' key on'参数指的是 JSON 对象 (state_geo) 中的标签,该标签将州详细信息作为附加到每个国家/地区边界信息的要素 ID。我们在数据框中的状态应该与 json 对象中的特征 ID 匹配。
Syntax: folium.Choropleth(geo_data,name,data,columns,fill_color, fill_opacity, line_opacity, key_on,legend_name)
Parameters:
- geo_data: a set of geographic regions and their boundary coordinates
- name: String (name of our map)
- data: a numeric value for each region, used for the color
- columns: list (columns we need to work on)
- fill_color: Color of the map, eg: YlGn
- fill_opacity: opacity of the colors filled
- line_opacity: opacity of the border lines
- legend_name: String
最后,我们可以将地图保存为 HTML 文件。
蟒蛇3
folium.Choropleth(

      # geographical locations
    geo_data = state_geo,
    name = "choropleth",

      # the data set we are using
    data = state_data,
    columns = ["State", "Unemployment"],

      # YlGn refers to yellow and green
    fill_color = "YlGn",
    fill_opacity = 0.7,
    line_opacity = .1,
      key_on = "feature.id",
    legend_name = "Unemployment Rate (%)",
).add_to(m)

m.save('final_map.html')
输出:
