在 Matplotlib 中更改字体大小
Matplotlib 库主要用于创建二维图形和绘图。它有一个名为 pyplot 的模块,它使绘图变得容易。要在 Matplotlib 中更改字体大小,可以使用下面给出的两种方法和适当的参数:
方法一: matplotlib.rcParams.update()
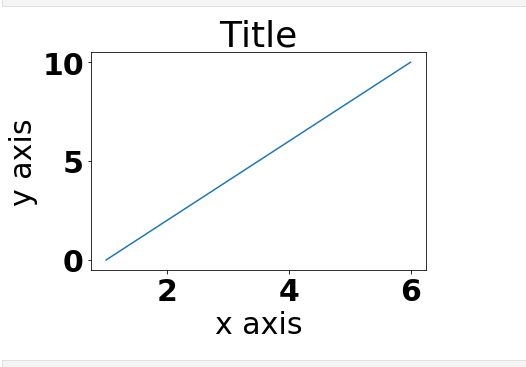
rcParams 是 matplotlib 库的一个实例,用于处理默认的 matplotlib 值,因此要更改默认字体大小,我们只需将值传递给键 font.size
方法:
- 导入模块
- 创建数据
- 将 rcParams.update() 的值设置为 font.size 键。
- 通常绘制数据
- 显示图
例子:
Python3
import matplotlib.pyplot as plt

# setting font sizeto 30
plt.rcParams.update({'font.size': 30})

x = [1, 2, 3, 4, 5, 6]
y = [0, 2, 4, 6, 8, 10]

# plotting a plot
plt.plot(x, y)

# setting title name
plt.title("Title")

# setting x axis label
plt.xlabel("x axis")

# setting y axis label
plt.ylabel("y axis")

plt.show()
Python3
import matplotlib.pyplot as plt


# creating a dictionary
font = {'size': 10}

# using rc function
plt.rc('font', **font)

x = [1, 2, 3, 4, 5, 6]
y = [0, 2, 4, 6, 8, 10]

# plotting a plot
plt.plot(x, y)

# setting title name
plt.title("Title")

# setting x axis label
plt.xlabel("x axis")

# setting y axis label
plt.ylabel("y axis")

plt.show()
输出:

方法二: matplotlib.rc(group, **kwargs):
此函数设置当前的 rc 参数。 group 是 rc 的分组,如 line、font、axes 等,kwargs 是字典属性名称和值对。
方法:
- 导入模块
- 创建数据
- 创建一个字体字典来传递字体的值
- 将此字体值提供给 rc()
- 通常绘制数据
- 显示数据
例子:
蟒蛇3
import matplotlib.pyplot as plt


# creating a dictionary
font = {'size': 10}

# using rc function
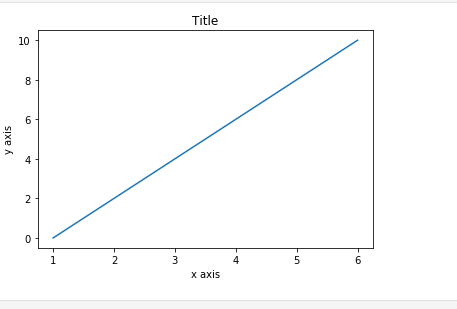
plt.rc('font', **font)

x = [1, 2, 3, 4, 5, 6]
y = [0, 2, 4, 6, 8, 10]

# plotting a plot
plt.plot(x, y)

# setting title name
plt.title("Title")

# setting x axis label
plt.xlabel("x axis")

# setting y axis label
plt.ylabel("y axis")

plt.show()
输出:
