Python中的随机森林回归
每棵决策树都有高方差,但是当我们将它们并行组合在一起时,结果方差很低,因为每棵决策树都在该特定样本数据上得到了完美的训练,因此输出不依赖于一个决策树,而是多个决策树木。在分类问题的情况下,使用多数投票分类器获取最终输出。在回归问题的情况下,最终输出是所有输出的平均值。这部分是聚合。
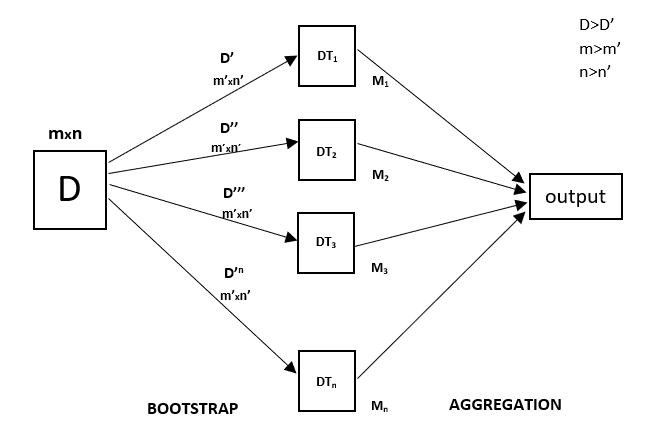
随机森林是一种集成技术,能够使用多个决策树和一种称为 Bootstrap 和聚合的技术(通常称为bagging )来执行回归和分类任务。这背后的基本思想是结合多个决策树来确定最终输出,而不是依赖于单个决策树。
随机森林有多个决策树作为基础学习模型。我们从数据集中随机执行行采样和特征采样,形成每个模型的样本数据集。这部分称为引导程序。
我们需要像任何其他机器学习技术一样使用随机森林回归技术
- 设计一个特定的问题或数据并获取源以确定所需的数据。
- 确保数据是可访问的格式,否则将其转换为所需的格式。
- 指定获得所需数据可能需要的所有明显异常和缺失数据点。
- 创建机器学习模型
- 设置您想要实现的基线模型
- 训练数据机器学习模型。
- 使用测试数据提供对模型的洞察
- 现在比较测试数据和模型预测数据的性能指标。
- 如果它不能满足您的期望,您可以尝试相应地改进您的模型或确定您的数据日期或使用其他数据建模技术。
- 在这个阶段,您解释您获得的数据并相应地报告。
您将在以下示例中使用类似的示例技术。
例子
下面是随机森林回归的逐步示例实现。
第 1 步:导入所需的库。
python
# Importing the libraries
import numpy as np
import matplotlib.pyplot as plt
import pandas as pd
python
data = pd.read_csv('Salaries.csv')
print(data)
python
# Fitting Random Forest Regression to the dataset
# import the regressor
from sklearn.ensemble import RandomForestRegressor

 # create regressor object
regressor = RandomForestRegressor(n_estimators = 100, random_state = 0)

# fit the regressor with x and y data
regressor.fit(x, y)
python
Y_pred = regressor.predict(np.array([6.5]).reshape(1, 1)) # test the output by changing valuespython
# Visualising the Random Forest Regression results
# arrange for creating a range of values
# from min value of x to max
# value of x with a difference of 0.01
# between two consecutive values
X_grid = np.arrange(min(x), max(x), 0.01)
# reshape for reshaping the data into a len(X_grid)*1 array,
# i.e. to make a column out of the X_grid value
X_grid = X_grid.reshape((len(X_grid), 1))
# Scatter plot for original data
plt.scatter(x, y, color = 'blue')
# plot predicted data
plt.plot(X_grid, regressor.predict(X_grid),
color = 'green')
plt.title('Random Forest Regression')
plt.xlabel('Position level')
plt.ylabel('Salary')
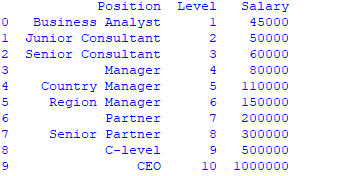
plt.show()第 2 步:导入并打印数据集
Python
data = pd.read_csv('Salaries.csv')
print(data)
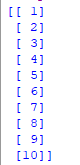
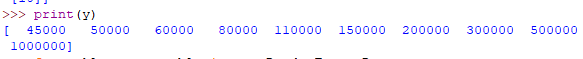
第 3 步:从数据集中选择所有行和第 1 列到 x,选择所有行和第 2 列作为 y
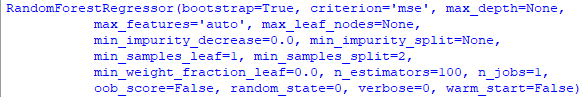
第 4 步:将随机森林回归器拟合到数据集
Python
# Fitting Random Forest Regression to the dataset
# import the regressor
from sklearn.ensemble import RandomForestRegressor

 # create regressor object
regressor = RandomForestRegressor(n_estimators = 100, random_state = 0)

# fit the regressor with x and y data
regressor.fit(x, y)
第 5 步:预测新结果
Python
Y_pred = regressor.predict(np.array([6.5]).reshape(1, 1)) # test the output by changing values
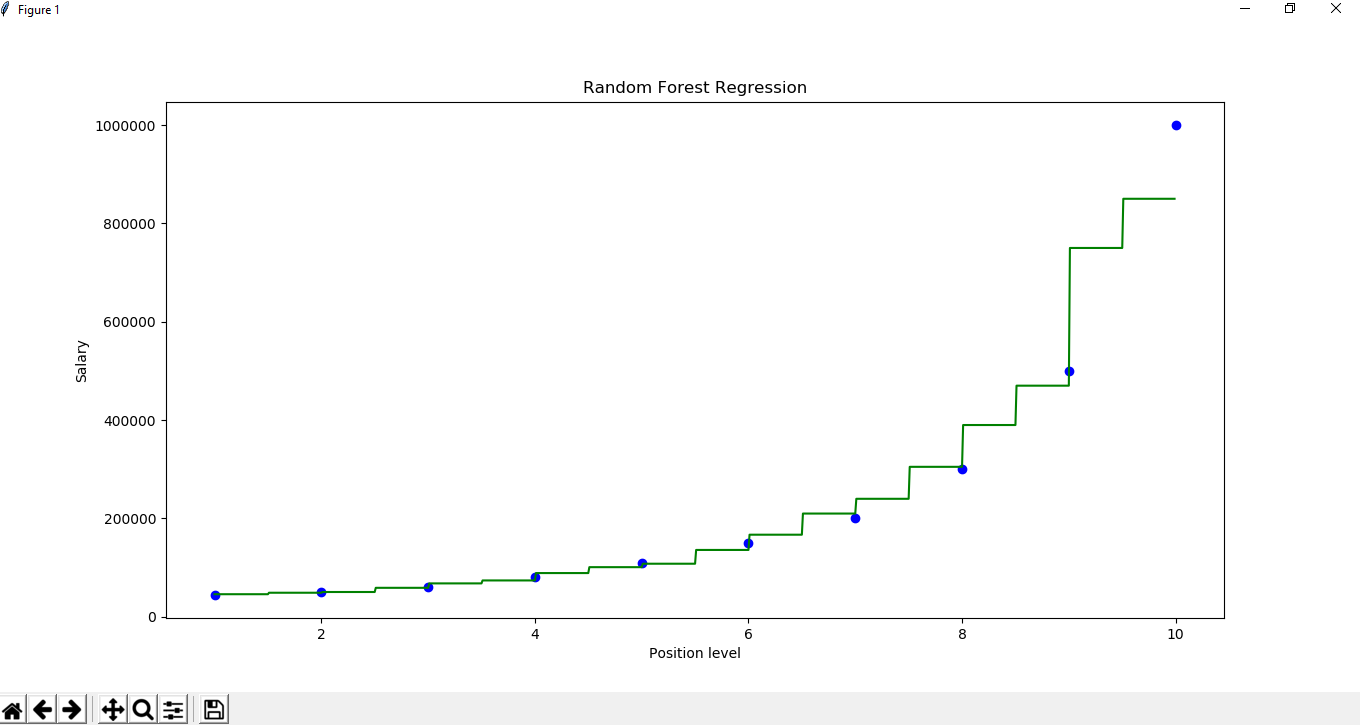
第 6 步:可视化结果
Python
# Visualising the Random Forest Regression results

# arrange for creating a range of values
# from min value of x to max
# value of x with a difference of 0.01
# between two consecutive values
X_grid = np.arrange(min(x), max(x), 0.01)

# reshape for reshaping the data into a len(X_grid)*1 array,
# i.e. to make a column out of the X_grid value
X_grid = X_grid.reshape((len(X_grid), 1))

# Scatter plot for original data
plt.scatter(x, y, color = 'blue')

# plot predicted data
plt.plot(X_grid, regressor.predict(X_grid),
         color = 'green')
plt.title('Random Forest Regression')
plt.xlabel('Position level')
plt.ylabel('Salary')
plt.show()