Pandas – 按时间间隔滚动平均值
在本文中,我们将研究如何在Python中使用 Pandas 按时间间隔计算数据帧的滚动平均值。
熊猫dataframe.rolling() 是一个帮助我们在滚动窗口上进行计算的函数。换句话说,我们取一个固定大小的窗口并对其进行一些数学计算。
Syntax: DataFrame.rolling(window, min_periods=None, center=False, win_type=None, on=None, axis=0).mean()
Parameters :
- window : Size of the window. That is how many observations we have to take for the calculation of each window.
- min_periods : Least number of observations in a window required to have a value (otherwise result is NA).
- center : It is used to set the labels at the center of the window.
- win_type : It is used to set the window type.
- on : Datetime column of our dataframe on which we have to calculate rolling mean.
- axis : integer or string, default 0
使用的数据集: Tesla_Stock
逐步实施
第 1 步:导入库
Python3
# import pandas as pd
import pandas as pd
Python3
# importing Data
tesla_df = pd.read_csv('Tesla_Stock.csv', index_col='Date',
                       parse_dates=True)

# printing the dataFrame
tesla_df.head(10)
Python3
# Updating the dataFrame with just the
# column 'Close' as others columns are
# of no use right now we have used .to_frame
# which converts Series to a DataFrame.
tesla_df = tesla_df['Close'].to_frame()


# calculating Rolling mean and storing it
# into a new column of existing dataFrame
# we have set the window as 30 and rest all
# parameters are set to default.
tesla_df['MA30'] = tesla_df['Close'].rolling(30).mean()

# Rolling mean is also called as Moving Average ,
# hence we have used the notation MA
# and MA30 is the moving average (rolling mean)
# of 30 days

# printing dataframe
tesla_df
Python3
# calculating Rolling mean and storing it into
# a new column of existing dataFrame we have set
# the window as 200 and rest all parameters are
# set to default.
tesla_df['MA200'] = tesla_df['Close'].rolling(200).mean()

# Rolling mean is also called as Moving Average, hence
# we have used the notation MA and MA200 is the moving
# average (rolling mean) of 200 days

# printing dataframe
tesla_df
Python3
# importing matplotlib module
import matplotlib.pyplot as plt
plt.style.use('default')

# %matplotlib inline: only draw static
# images in the notebook
%matplotlib inline

tesla_df[['Close', 'MA30', 'MA200']].plot(
  label='tesla', figsize=(16, 8))
第 2 步:导入数据
Python3
# importing Data
tesla_df = pd.read_csv('Tesla_Stock.csv', index_col='Date',
                       parse_dates=True)

# printing the dataFrame
tesla_df.head(10)
输出:

我们将计算 DataFrame 的“关闭”列的滚动平均值。
第 3 步:计算滚动平均值
Python3
# Updating the dataFrame with just the
# column 'Close' as others columns are
# of no use right now we have used .to_frame
# which converts Series to a DataFrame.
tesla_df = tesla_df['Close'].to_frame()


# calculating Rolling mean and storing it
# into a new column of existing dataFrame
# we have set the window as 30 and rest all
# parameters are set to default.
tesla_df['MA30'] = tesla_df['Close'].rolling(30).mean()

# Rolling mean is also called as Moving Average ,
# hence we have used the notation MA
# and MA30 is the moving average (rolling mean)
# of 30 days

# printing dataframe
tesla_df
输出:
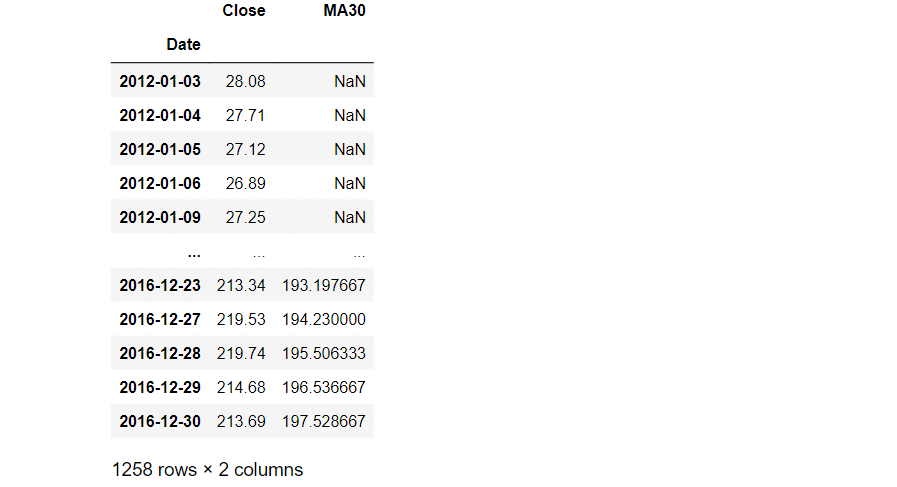
MA30 列的前 29 行的值为 NULL,第一个非 NULL 值位于第 30 行。现在我们将计算窗口为 200 的滚动平均值。
Python3
# calculating Rolling mean and storing it into
# a new column of existing dataFrame we have set
# the window as 200 and rest all parameters are
# set to default.
tesla_df['MA200'] = tesla_df['Close'].rolling(200).mean()

# Rolling mean is also called as Moving Average, hence
# we have used the notation MA and MA200 is the moving
# average (rolling mean) of 200 days

# printing dataframe
tesla_df
输出:
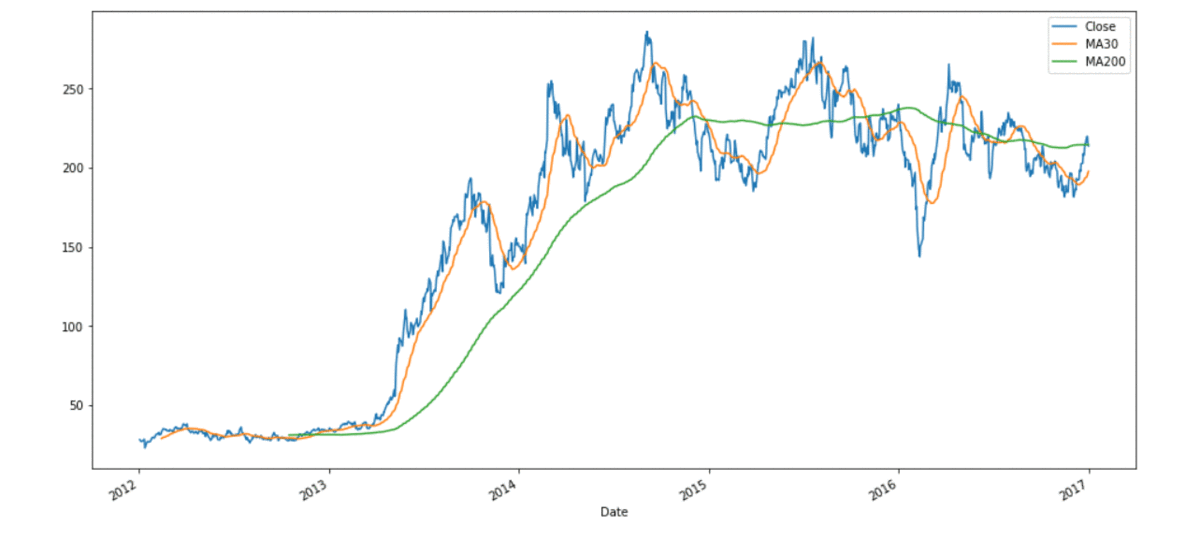
对于“MA200”,第一个非 NULL 将位于第 200 行。现在让我们绘制“MA30”、“MA200”和“关闭”以获得更好的可视化效果
第 4 步:绘图
Python3
# importing matplotlib module
import matplotlib.pyplot as plt
plt.style.use('default')

# %matplotlib inline: only draw static
# images in the notebook
%matplotlib inline

tesla_df[['Close', 'MA30', 'MA200']].plot(
  label='tesla', figsize=(16, 8))
输出: