忽略 R 中 ggplot2 Boxplot 中的异常值
在本文中,我们将了解如何在 R 编程语言中忽略或删除 ggplot2 Boxplot 中的异常值。
删除/忽略异常值通常不是一个好主意,因为突出显示异常值通常是使用箱线图的优势之一。然而,另一方面,有时极端异常值会改变箱线图的大小并掩盖其他特征,因此在这些情况下最好将它们排除在外。我们可以通过将 outlier.shape 参数设置为 NA 来删除 R 中的异常值。此外, coord_cartesian()函数将用于拒绝所有超过或低于给定四分位数的异常值。 ggplot2 的 y 轴不会自动调整。您可以使用 coord_cartesian()函数调整轴。
为了创建带有异常值的 Boxplot,我们需要两个函数,一个是 ggplot(),另一个是 geom_boxplot()
使用的数据集: Crop_recommendation
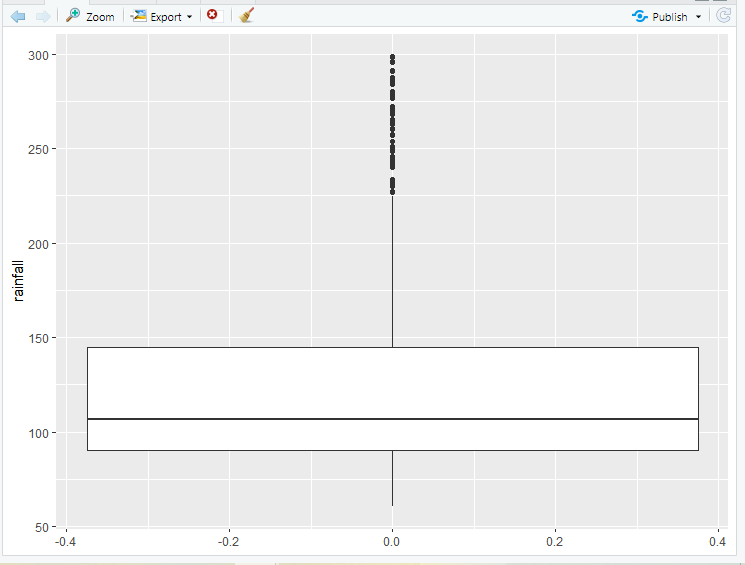
让我们首先创建一个常规的箱线图,不删除任何异常值以使差异变得明显。
例子:
R
# Loading
library(ggplot2)

# loading data set and storing it in ds variable
ds <- read.csv("c://crop//archive//Crop_recommendation.csv", header = TRUE)
ds

# create a boxplot by using geom_boxplot()
# function of ggplot2 package with outliers
box_plot_crop<-ggplot(data=ds, aes( y=rainfall))

box_plot_crop+geom_boxplot()
R
# Loading
library(ggplot2)

# loading data set and storing it in ds variable
ds <- read.csv("c://crop//archive//Crop_recommendation.csv", header = TRUE)
ds

# remove outliers or create boxplot without outliers
box_plot_crop<-ggplot(data=ds, aes(y = rainfall))
box_plot_crop+ geom_boxplot(outlier.shape = NA) +
  coord_cartesian(ylim =  c(50, 300))
输出:
现在,要删除异常值,您可以使用 outlier.shape 到 NA 参数。
句法:
geom_boxplot(outlier.shape = NA)
您可以使用 coord_cartesian()函数直接更改轴,因为 ggplot2 不会自动调整轴。在 coord_catesian() 中,您可以使用参数 ylim 或 xlim 设置轴的限制。
Syntax:
coord_cartesian( xlim = NULL, ylim = NULL, expand = TRUE, default = FALSE, clip = “on )
Parameters:
- xlim, ylim-> set the limits of x and y-axis and also allows zooming in and zoom out.
- expand– It is TRUE by default, and if it is TRUE then it increases the limit by a small amount to ensure that data and axes do not overlap. and if it is FALSE then the limit is taken from the exact data or the xlim/ ylim.
- default– used for checking is this is the default coordinate system
- clip- It checks Should the drawing be cropped to fit the plot panel
例子:
电阻
# Loading
library(ggplot2)

# loading data set and storing it in ds variable
ds <- read.csv("c://crop//archive//Crop_recommendation.csv", header = TRUE)
ds

# remove outliers or create boxplot without outliers
box_plot_crop<-ggplot(data=ds, aes(y = rainfall))
box_plot_crop+ geom_boxplot(outlier.shape = NA) +
  coord_cartesian(ylim =  c(50, 300))
输出:
