使用Python创建带有平滑线的散点图
可以平滑曲线以达到可视化的近似概念。在本文中,我们将在 SciPy 库的帮助下用平滑线绘制散点图。要绘制平滑线散点图,我们使用以下函数:
- SciPy 库中的scipy.interpolate.make_interp_spline()计算插值 B 样条的系数。通过从 Scipy 库中导入这个函数并添加参数,可以更容易地获得平滑线到散点图。
Syntax:
scipy.interpolate.make_interp_spline(x, y, k=3, t=None, bc_type=None, axis=0, check_finite=True)
Parameters:
- x:-Abscissas
- y:-Ordinates
- k:-B-spline degree
- t:-Knots
- bc_type:-Boundary conditions
- axis:-Interpolation axis
- check_finite:-Whether to check that the input arrays contain only finite numbers
Return: a BSpline object of the degree k and with knots t.
- np.linspace()函数被导入 来自 NumPy 库,用于在指定间隔内获得均匀间隔的数字,用于绘制平滑线散点图。
Syntax:
numpy.linspace(start, stop, num=50, endpoint=True, retstep=False, dtype=None, axis=0)
Parameters:
- start:-The starting value of the sequence.
- stop:-The end value of the sequence.
- num:-Number of samples to generate.
- endpoint:-If True, stop is the last sample.
- retstep:-If True, return (samples, step), where the step is the spacing between samples.
- dtype:-The type of the output array.
- axis:- The axis in the result to store the samples.
Return: A array of num equally spaced samples in the closed interval
方法
- 导入模块
- 创建或加载数据
- 创建散点图
- 从散点图的点创建平滑曲线
- 显示图
让我们从示例散点图开始。
例子:
Python3
import numpy as np
import matplotlib.pyplot as plt

x = np.array([1, 2, 3, 4, 5])

y = np.array([4, 9, 1, 3, 5])

plt.scatter(x, y)

plt.show()
Python3
import numpy as np
import matplotlib.pyplot as plt

x = np.array([1, 2, 3, 4, 5])

y = np.array([4, 9, 1, 3, 5])

plt.plot(x, y)

plt.show()
Python3
import numpy as np
import matplotlib.pyplot as plt
from scipy.interpolate import make_interp_spline

x = np.array([1, 2, 3, 4, 5])
y = np.array([4, 9, 1, 3, 5])

xnew = np.linspace(x.min(), x.max(), 300)

gfg = make_interp_spline(x, y, k=3)

y_new = gfg(xnew)

plt.plot(xnew, y_new)

plt.show()
输出:

现在让我们通过连接散点图的点来可视化散点图,以便可以出现不均匀的曲线,即没有平滑,以便差异可以明显。
例子:
蟒蛇3
import numpy as np
import matplotlib.pyplot as plt

x = np.array([1, 2, 3, 4, 5])

y = np.array([4, 9, 1, 3, 5])

plt.plot(x, y)

plt.show()
输出:

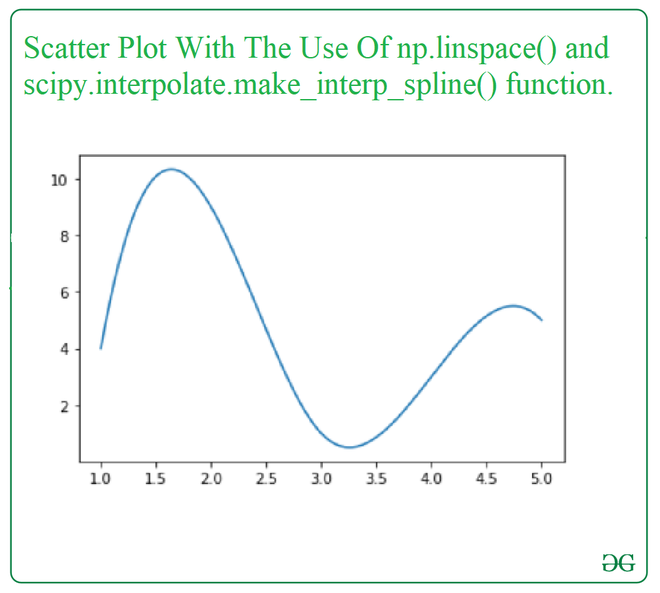
现在,我们将使用 np.linspace() 和 scipy.interpolate.make_interp_spline()函数查看与上面相同的示例。
例子:
蟒蛇3
import numpy as np
import matplotlib.pyplot as plt
from scipy.interpolate import make_interp_spline

x = np.array([1, 2, 3, 4, 5])
y = np.array([4, 9, 1, 3, 5])

xnew = np.linspace(x.min(), x.max(), 300)

gfg = make_interp_spline(x, y, k=3)

y_new = gfg(xnew)

plt.plot(xnew, y_new)

plt.show()
输出:
