在 R 中从 CSV 创建散点图
在 R 编程语言中,我们使用plot()函数来显示散点图。它需要八个参数。
Syntax: plot(x, y, main, xlab, ylab, xlim, ylim, axes)
Parameters:
- x: sets variable to be used for horizontal coordinates.
- y: sets variable to be used for vertical coordinates.
- xlab: label for horizontal axis.
- ylab: label for vertical axis.
- main: title of the chart.
- xlim: limits of x for plotting values of x.
- ylim: limits of y for plotting values of y.
- axes: it indicates whether both axes should be drawn on the plot.
要设置散点图的属性,例如散点图的颜色和形状,我们使用“col”属性来设置散点图的颜色,并使用“pch”来设置形状,其中 pch 取 0 到 25 之间的数值。
创建数据框:
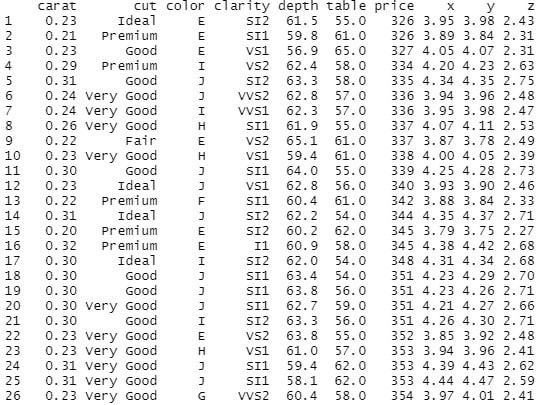
在这里,我们将从这个数据集创建数据框。我们使用 read.csv() 读取 csv 文件并将该数据存储在一个变量中。
R
csv_data<-read.csv("diamonds.csv")
print(csv_data)
R
plot(x = csv_data$carat,
     y = csv_data$price,
     xlab = "Carat",
     ylab = "Price",
     main = "Price vs Carat")
R
plot(x = csv_data$carat,
     y = csv_data$price,
     xlab = "Carat",
     ylab = "Price",
     col = "green",
     pch = 4,
     main = "Price vs Carat")
R
plot(x = csv_data$carat,
     y = csv_data$price,
     xlab = "Carat",
     ylab = "Price",
     col = "green",
     pch = 4,
     main = "Price vs Carat")

abline(lm(csv_data$price ~ csv_data$carat,
          data = csv_data), col = "black")
输出:

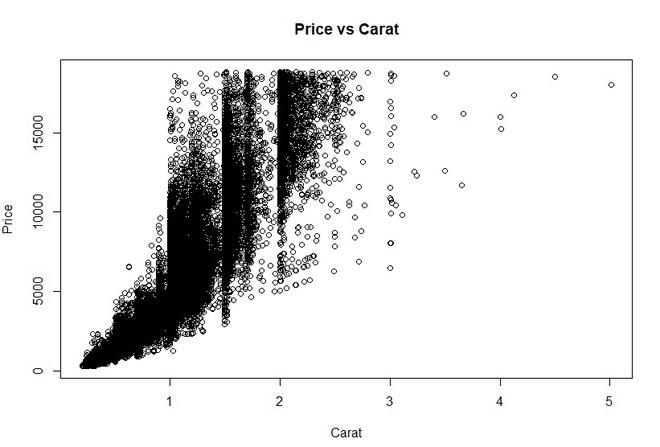
示例 1:在本示例中,我们创建了一个简单的散点图,其中 x 设置为克拉,y 设置为价格。我们将该图标记为价格 vs 克拉。
Syntax: plot(x, y, main, xlab, ylab, col, pch)
Where x is carat data, y is price data, xlab is label for x as “Carat” and ylab is label for y as “Price”.
电阻
plot(x = csv_data$carat,
     y = csv_data$price,
     xlab = "Carat",
     ylab = "Price",
     main = "Price vs Carat")
输出:

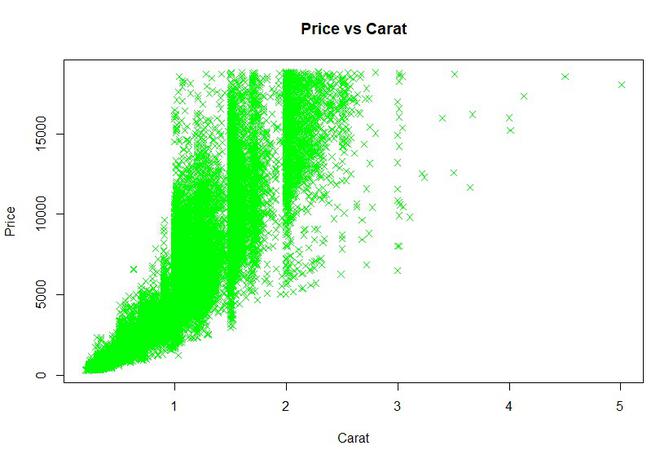
示例 2:在本示例中,我们尝试设置散点图的属性,例如散点图的颜色和形状。我们设置 pch 值 4,其中值 4 表示为“x”,颜色设置为绿色。
电阻
plot(x = csv_data$carat,
     y = csv_data$price,
     xlab = "Carat",
     ylab = "Price",
     col = "green",
     pch = 4,
     main = "Price vs Carat")
输出:

示例 3:我们还可以使用 abline()函数向散点图添加回归线。我们传递 2 个参数,其中首先传递 lm()函数(lm()函数用于拟合线性模型。)其中我们指定数据集的 x 和 y 以及数据名称,第二个参数是线条的颜色.
电阻
plot(x = csv_data$carat,
     y = csv_data$price,
     xlab = "Carat",
     ylab = "Price",
     col = "green",
     pch = 4,
     main = "Price vs Carat")

abline(lm(csv_data$price ~ csv_data$carat,
          data = csv_data), col = "black")
输出:
