R编程中的均方根误差
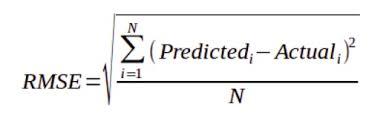
均方根误差 (RMSE) 是所有误差的平方均值的平方根。 RMSE 被认为是用于数值预测的优秀通用误差度量。 RMSE 是一种很好的准确度度量,但仅用于比较不同模型或模型配置对特定变量的预测误差,而不是变量之间的预测误差,因为它与尺度相关。它是回归线与数据点拟合程度的度量。 RMSE的计算公式为: 
where,
predictedi = The predicted value for the ith observation.
actuali = The observed(actual) value for the ith observation
N = Total number of observations.
Note: The difference between the actual values and the predicted values is known as residuals.
RMSE的实现
R 中Metrics包中可用的rmse()函数用于计算实际值和预测值之间的均方根误差。
Syntax:
rmse(actual, predicted)
Parameters:
actual: The ground truth numeric vector.
predicted: The predicted numeric vector, where each element in the vector is a prediction for the corresponding element in actual.
示例 1:
让我们定义两个向量实际向量与基本实况数值和预测向量与预测数值,其中向量中的每个元素是实际对应元素的预测。
# R program to illustrate RMSE

# Importing the required package
library(Metrics)

# Taking two vectors
actual = c(1.5, 1.0, 2.0, 7.4, 5.8, 6.6)
predicted = c(1.0, 1.1, 2.5, 7.3, 6.0, 6.2)

# Calculating RMSE using rmse()
result = rmse(actual, predicted)

# Printing the value
print(result)
输出:
[1] 0.3464102
示例 2:
在此示例中,让我们获取数据集库中的树木数据,该数据代表对黑樱桃树进行的研究中的数据。
# Importing required packages
library(datasets)
library(tidyr)
library(dplyr)

# Access the data from R’s datasets package
data(trees)

# Display the data in the trees dataset
trees
输出:
Girth Height Volume
1    8.3     70   10.3
2    8.6     65   10.3
3    8.8     63   10.2
4   10.5     72   16.4
5   10.7     81   18.8
6   10.8     83   19.7
7   11.0     66   15.6
8   11.0     75   18.2
9   11.1     80   22.6
10  11.2     75   19.9
11  11.3     79   24.2
12  11.4     76   21.0
13  11.4     76   21.4
14  11.7     69   21.3
15  12.0     75   19.1
16  12.9     74   22.2
17  12.9     85   33.8
18  13.3     86   27.4
19  13.7     71   25.7
20  13.8     64   24.9
21  14.0     78   34.5
22  14.2     80   31.7
23  14.5     74   36.3
24  16.0     72   38.3
25  16.3     77   42.6
26  17.3     81   55.4
27  17.5     82   55.7
28  17.9     80   58.3
29  18.0     80   51.5
30  18.0     80   51.0
31  20.6     87   77.0
# Look at the structure
# Of the variables
str(trees)
输出:
'data.frame':   31 obs. of  3 variables:
 $ Girth : num  8.3 8.6 8.8 10.5 10.7 10.8 11 11 11.1 11.2 ...
 $ Height: num  70 65 63 72 81 83 66 75 80 75 ...
 $ Volume: num  10.3 10.3 10.2 16.4 18.8 19.7 15.6 18.2 22.6 19.9 ...
该数据集由 3 个数值变量的 31 个观测值组成,以树干周长、高度和体积作为变量来描述黑樱桃树。现在,尝试拟合线性回归模型来根据给定的树干周长预测树干的体积。在这种情况下,R 中的简单线性回归模型将有所帮助。让我们深入研究并建立一个将树体积与周长相关联的线性模型。 R 使用基本函数lm()使这一点变得简单。该模型在从周长预测这棵树的体积方面做得如何?使用predict()函数,一个用于预测模型拟合函数的通用 R函数。 predict()将线性回归模型和我们想要响应变量值的预测变量的值作为参数。
# Building a linear model
# Relating tree volume to girth
fit_1 <- lm(Volume ~ Girth, data = trees)
trees.Girth = trees %>% select(Girth)

# Use predict function to predict volume
data.predicted = c(predict(fit_1, data.frame(Girth = trees.Girth)))
data.predicted
输出:
1         2         3         4         5         6         7         8         9
 5.103149  6.622906  7.636077 16.248033 17.261205 17.767790 18.780962 18.780962 19.287547
       10        11        12        13        14        15        16        17        18
19.794133 20.300718 20.807304 20.807304 22.327061 23.846818 28.406089 28.406089 30.432431
       19        20        21        22        23        24        25        26        27
32.458774 32.965360 33.978531 34.991702 36.511459 44.110244 45.630001 50.695857 51.709028
       28        29        30        31
53.735371 54.241956 54.241956 67.413183
现在我们有了樱桃树树干的实际体积和由线性回归模型驱动的预测体积。最后使用rmse()函数得到实际值和预测值之间的相对误差。
# Load the Metrics package
library(Metrics)

# Applying rmse() function
rmse(trees$Volume, predict(fit_1, data.frame(Girth = trees.Girth)))
输出:
[1] 4.11254
因为误差值为4.11254 ,这对于线性模型来说是一个很好的分数。但可以通过添加更多预测变量(多重回归模型)进一步减少它。因此,总而言之,可以说使用 R 很容易找到均方根误差。可以使用 R 中的rmse()函数来执行此任务。