- Highcharts-快速指南(1)
- Highcharts-快速指南
- GWT Highcharts-快速指南
- PHP 7-快速指南
- PHP 7-快速指南(1)
- Angular Highcharts教程(1)
- Angular Highcharts教程
- Highcharts-饼图(1)
- Highcharts-饼图
- Angular Highcharts-环境设置
- Angular Highcharts-环境设置(1)
- AJAX-快速指南(1)
- AJAX-快速指南
- JDBC-快速指南
- JDBC-快速指南(1)
- 移动计算-快速指南(1)
- 移动计算-快速指南
- 区块链-快速指南
- Angular Highcharts-有用的资源
- Angular Highcharts-有用的资源(1)
- 敏捷-快速指南(1)
- 敏捷-快速指南
- Underscore.JS-快速指南
- Underscore.JS-快速指南(1)
- Angular Highcharts-配置语法
- Angular Highcharts-配置语法(1)
- Bulma-快速指南(1)
- Bulma-快速指南
- Pytest-快速指南
📅 最后修改于: 2020-10-28 04:44:06 🧑 作者: Mango
角度高图-概述
HighChart Angular Wrapper是一个基于角度的开源组件,可在Angular应用程序中提供优雅且功能丰富的Highcharts可视化效果,并可与Angular组件无缝使用。有几章讨论了Highcharts的所有基本组件,并在Angular应用程序中提供了合适的示例。
特征
-
兼容–支持所有现代浏览器以及iPhone / iPad浏览器和Internet Explorer 6及更高版本。现代浏览器使用SVG进行图形渲染,并且在旧版Internet Explorer中使用VML绘制图形。
-
Pure TypeScript-不需要JavaScript,因为TypeScript中提供了完整的Highcharts API。
-
无Flash-不需要客户端插件(如Flash Player或Java),因为Highcharts使用本机浏览器技术,并且图表无需修改即可在现代移动设备上运行。
-
干净的语法-大多数方法都是可链接的,因此可以使用与JSON一样严格的语法来管理图表的配置选项。
-
动态-创建图表后,可以随时动态添加系列和点。支持事件挂钩。支持服务器交互。
-
已记录-Highcharts API已通过大量代码和语法示例进行了全面记录。
Angular Highcharts-环境设置
本教程将指导您如何准备开发环境以开始使用Highcharts和Angular Framework。在本章中,我们将讨论Angular 6所需的环境设置。要安装Angular 6,我们需要满足以下条件-
- Nodejs
- Npm
- 角度CLI
- 用于编写代码的IDE
Nodejs必须大于8.11,npm必须大于5.6。
Nodejs
要检查系统上是否安装了nodejs,请在终端中键入node -v 。这将帮助您查看系统上当前安装的nodejs的版本。
C:\>node -v
v8.11.3
如果它没有打印任何内容,请在系统上安装nodejs。要安装nodejs,请转到nodejs的主页https://nodejs.org/en/download/ ,然后根据您的操作系统安装该软件包。
nodejs的主页如下所示:
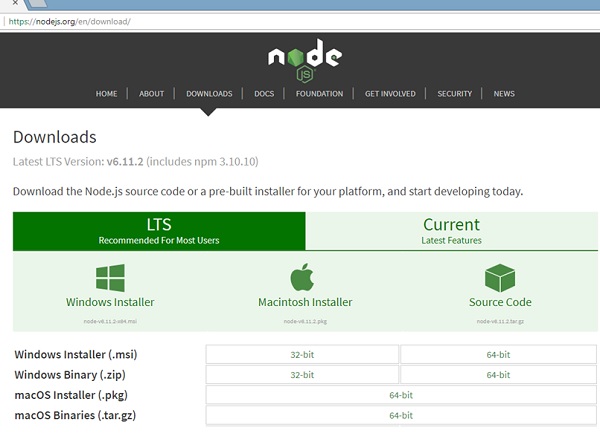
根据您的操作系统,安装所需的软件包。安装nodejs后,npm也将随之安装。要检查是否已安装npm,请在终端中键入npm -v。它应该显示npm的版本。
C:\>npm -v
5.6.0
借助angular CLI,Angular 6安装非常简单。访问angular的主页https://cli.angular.io/获取该命令的参考。

键入npm install -g @ angular / cli ,以在系统上安装angular cli。
一旦安装了Angular CLI,您将在终端中获得以上安装。您可以使用您选择的任何IDE,即WebStorm,Atom,Visual Studio Code等。
安装图表
运行以下命令以在创建的项目中安装highchart模块。
highchartsApp>npm install highcharts --save
+ highcharts@6.2.0
added 1 package in 137.534s
运行以下命令以在创建的项目中安装highchart包装器模块。
highchartsApp>npm install highcharts-angular --save
+ highcharts-angular@2.3.1
added 1 package in 20.93s
在highchartsApp.module.ts文件中添加以下条目
import { HighchartsChartComponent } from 'highcharts-angular';
declarations: [
   ...
   HighchartsChartComponent
],
Angular Highcharts-配置语法
在本章中,我们将展示使用Angular中的Highcharts API绘制图表所需的配置。
第1步-创建Angular应用程序
请按照以下步骤更新我们在Angular 6-Project Setup一章中创建的Angular应用程序–
| Step | Description |
|---|---|
| 1 | Create a project with a name highchartsApp as explained in the Angular 6 – Project Setup chapter. |
| 2 | Modify app.module.ts, app.component.ts and app.component.html as explained below. Keep rest of the files unchanged. |
| 3 | Compile and run the application to verify the result of the implemented logic. |
以下是修改后的模块描述符app.module.ts的内容。
import { BrowserModule } from '@angular/platform-browser';
import { NgModule } from '@angular/core';
import { AppComponent } from './app.component';
import { HighchartsChartComponent } from 'highcharts-angular';
@NgModule({
   declarations: [
      AppComponent,
      HighchartsChartComponent
   ],
   imports: [
      BrowserModule,
   ],
   providers: [],
   bootstrap: [AppComponent]
})
export class AppModule { }
以下是修改后的HTML主机文件app.component.html的内容。
了解配置后,我们将最后看到更新的app.component.ts。
第2步-使用配置
创建Highcharts并创建chartOptions
highcharts = Highcharts;
   chartOptions = {
}
创建图表
使用chartOptions配置图表的类型,标题和副标题。
chart: {
   type: "spline"
},
x轴
使用chartOptions将代码配置为显示在X轴上。
xAxis:{
   categories:["Jan", "Feb", "Mar", "Apr", "May", "Jun", "Jul", "Aug", "Sep", "Oct", "Nov", "Dec"]
},
y轴
使用chartOptions配置要在Y轴上显示的标题。
yAxis: {
   title:{
      text:"Temperature °C"
   }
},
工具提示
配置工具提示。使用chartOptions将后缀添加到值(y轴)之后。
tooltip: {
   valueSuffix:" °C"
},
系列
使用chartOptions配置要在图表上显示的数据。系列是一个数组,其中该数组的每个元素代表图表上的一条线。
series: [
   {
      name: 'Tokyo',
      data: [7.0, 6.9, 9.5, 14.5, 18.2, 21.5, 25.2,26.5, 23.3, 18.3, 13.9, 9.6]
   },
   {
      name: 'New York',
      data: [-0.2, 0.8, 5.7, 11.3, 17.0, 22.0, 24.8,24.1, 20.1, 14.1, 8.6, 2.5]
   },
   {
      name: 'Berlin',
      data: [-0.9, 0.6, 3.5, 8.4, 13.5, 17.0, 18.6, 17.9, 14.3, 9.0, 3.9, 1.0]
   },
   {
      name: 'London',
      data: [3.9, 4.2, 5.7, 8.5, 11.9, 15.2, 17.0, 16.6, 14.2, 10.3, 6.6, 4.8]
   }
]
例
考虑以下示例,以进一步了解配置语法-
app.component.ts
import { Component } from '@angular/core';
import * as Highcharts from 'highcharts';
@Component({
selector: 'app-root',
templateUrl: './app.component.html',
styleUrls: ['./app.component.css']
})
export class AppComponent {
highcharts = Highcharts;
chartOptions = {
chart: {
type: "spline"
},
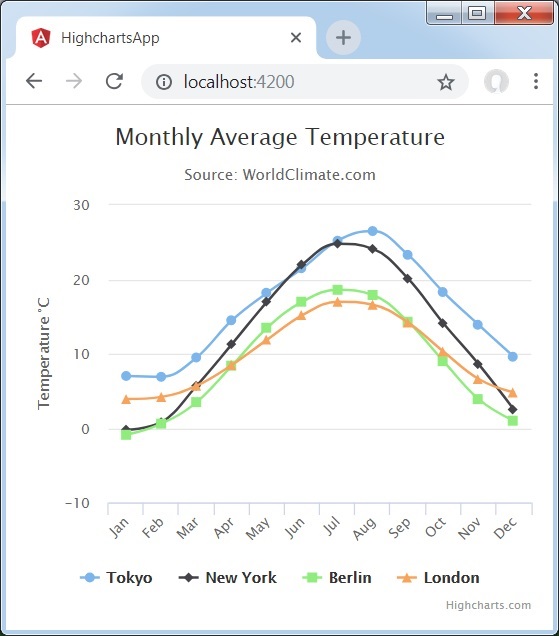
title: {
text: "Monthly Average Temperature"
},
subtitle: {
text: "Source: WorldClimate.com"
},
xAxis:{
categories:["Jan", "Feb", "Mar", "Apr", "May", "Jun",
"Jul", "Aug", "Sep", "Oct", "Nov", "Dec"]
},
yAxis: {
title:{
text:"Temperature °C"
}
},
tooltip: {
valueSuffix:" °C"
},
series: [
{
name: 'Tokyo',
data: [7.0, 6.9, 9.5, 14.5, 18.2, 21.5, 25.2,26.5, 23.3, 18.3, 13.9, 9.6]
},
{
name: 'New York',
data: [-0.2, 0.8, 5.7, 11.3, 17.0, 22.0, 24.8,24.1, 20.1, 14.1, 8.6, 2.5]
},
{
name: 'Berlin',
data: [-0.9, 0.6, 3.5, 8.4, 13.5, 17.0, 18.6, 17.9, 14.3, 9.0, 3.9, 1.0]
},
{
name: 'London',
data: [3.9, 4.2, 5.7, 8.5, 11.9, 15.2, 17.0, 16.6, 14.2, 10.3, 6.6, 4.8]
}
]
};
}
结果
验证结果。
角度高图-折线图
折线图用于绘制基于折线/样条的图表。在本节中,我们将讨论基于折线和样条图的不同类型。
| Sr.No | Chart Type & Description |
|---|---|
| 1 | Basic line
Basic line chart. |
| 2 | With data labels
Chart with data labels. |
| 3 | Time series, zoomable
Chart with time series. |
| 4 | Spline with inverted axes
Spline chart having inverted axes. |
| 5 | Spline with symbols
Spline chart using symbols for heat/rain. |
| 6 | Spline with plot bands
Spline chart with plot bands. |
角度高图-面积图
面积图用于绘制基于面积的图。在本节中,我们将讨论基于区域的图表的不同类型。
| Sr.No. | Chart Type & Description |
|---|---|
| 1 | Basic Area
Basic area chart. |
| 2 | Area with negative values
Area chart having negative values. |
| 3 | Stacked area
Chart having areas stacked over one another. |
| 4 | Percentage area
Chart with data in percentage terms. |
| 5 | Area with missing points
Chart with missing points in the data. |
| 6 | Inverted axes
Area using inverted axes. |
| 7 | Area-spline
Area chart using spline. |
角度高图-条形图
条形图用于绘制基于条形的图表。在本节中,我们将讨论基于条形图的不同类型。
| Sr.No. | Chart Type & Description |
|---|---|
| 1 | Basic Bar
Basic bar chart. |
| 2 | Stacked Bar
Bar chart having bar stacked over one another. |
| 3 | Bar Chart with negative values
Bar Chart with negative values. |
角度高图-柱形图
柱形图用于绘制基于柱形的图表。在本节中,我们将讨论基于列的图表的不同类型。
| Sr.No. | Chart Type & Description |
|---|---|
| 1 | Basic Column
Basic column chart. |
| 2 | Column with negative values
Column chart having negative values. |
| 3 | Stacked column
Chart having column stacked over one another. |
| 4 | Stacked and Grouped column
Chart with column in stacked and grouped form. |
| 5 | Column with stacked percentage
Chart with stacked percentage. |
| 6 | Column with rotated labels
Column Chart with rotated labels in columns. |
| 7 | Column Range
Column Chart using ranges. |
角度高图-饼图
GWP Highcharts-饼图
饼图用于绘制基于饼图的图表。在本节中,我们将讨论基于饼图的不同类型。
| Sr.No. | Chart Type & Description |
|---|---|
| 1 | Basic Pie
Basic pie chart. |
| 2 | Pie with Legends
Pie chart with Legends. |
| 3 | Donut Chart
Donut Chart. |
角度高图-散点图
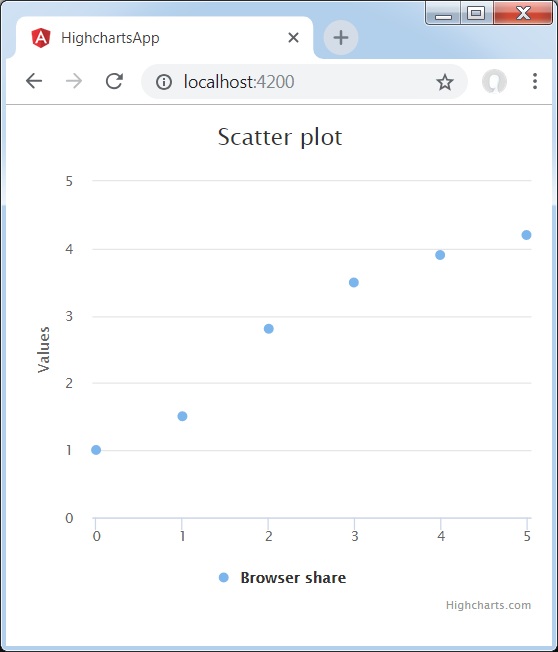
以下是基本散点图的示例。
我们已经在Highcharts配置语法一章中看到了用于绘制图表的配置。
下面给出了基本散点图的示例。
构型
现在让我们看看所采取的其他配置/步骤。
系列
将图表类型配置为基于散点图。 series.type决定图表的系列类型。在此,默认值为“ line”。
var chart = {
   type: 'scatter',
   zoomType: 'xy'
};
例
app.component.ts
import { Component } from '@angular/core';
import * as Highcharts from 'highcharts';
@Component({
  selector: 'app-root',
  templateUrl: './app.component.html',
  styleUrls: ['./app.component.css']
})
export class AppComponent {
   highcharts = Highcharts;
   chartOptions = {
      title : {
         text: 'Scatter plot'
      },
      series : [{
         type: 'scatter',
         zoomType:'xy',
         name: 'Browser share',
         data: [ 1, 1.5, 2.8, 3.5, 3.9, 4.2 ]
      }]
   };
}
结果
验证结果。
角度高图-动态图表
动态图表用于绘制基于数据的图表,其中在呈现图表后数据可能会发生变化。在本节中,我们将讨论动态图表的不同类型。
| Sr.No. | Chart Type & Description |
|---|---|
| 1 | Spline updating each second
Spline Chart updating each second. |
| 2 | Click to add a point
Chart with point addition capability. |
角度高图-组合
组合图用于绘制混合图;例如,条形图和饼图。在本节中,我们将讨论组合图的不同类型。
| Sr.No. | Chart Type & Description |
|---|---|
| 1 | Column, Line and Pie
Chart with Column, Line and Pie. |
| 2 | Dual Axes, Line and Column
Chart with Dual Axes, Line and Column. |
| 3 | Multiple Axes
Chart having Multiple Axes. |
| 4 | Scatter with regression line
Scatter chart with regression line. |
角度高图表-3D图表
3D图表用于绘制3D图表。在本节中,我们将讨论不同类型的3D图表。
| Sr.No. | Chart Type & Description |
|---|---|
| 1 | 3D Column
3D Column Chart. |
| 2 | 3D Scatter
3D Scatter Chart. |
| 3 | 3D Pie
3D Pie Chart. |
角度高图-地图图
地图图用于绘制热图或树形图。在本节中,我们将讨论地图的不同类型。
| Sr.No. | Chart Type & Description |
|---|---|
| 1 | Heat Map
Heat Map. |
| 2 | Tree Map
Tree Map. |