R语言中的直方图
直方图包含一个矩形区域,用于显示与变量频率及其在连续数值区间中的宽度成比例的统计信息。将一组数据点管理到不同的指定范围内的图形表示。它有一个特殊的功能,即条形之间没有间隙,类似于垂直条形图。
R – 直方图
我们可以使用 hist()函数在 R 编程语言中创建直方图。
Syntax: hist(v, main, xlab, xlim, ylim, breaks, col, border)
Parameters:
- v: This parameter contains numerical values used in histogram.
- main: This parameter main is the title of the chart.
- col: This parameter is used to set color of the bars.
- xlab: This parameter is the label for horizontal axis.
- border: This parameter is used to set border color of each bar.
- xlim: This parameter is used for plotting values of x-axis.
- ylim: This parameter is used for plotting values of y-axis.
- breaks: This parameter is used as width of each bar.
在 R 中创建一个简单的直方图
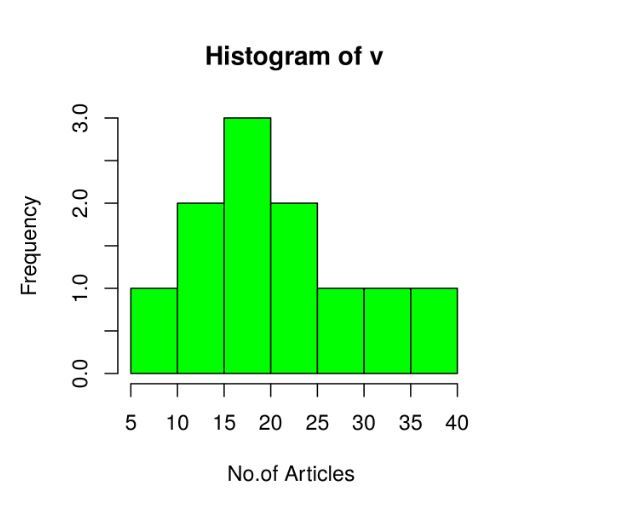
使用上述参数创建一个简单的直方图。这个向量v是使用hist()绘制的。
例子:
R
# Create data for the graph.
v <- c(19, 23, 11, 5, 16, 21, 32,
       14, 19, 27, 39)

# Create the histogram.
hist(v, xlab = "No.of Articles ",
     col = "green", border = "black")
R
# Create data for the graph.
v <- c(19, 23, 11, 5, 16, 21, 32, 14, 19, 27, 39)


# Create the histogram.
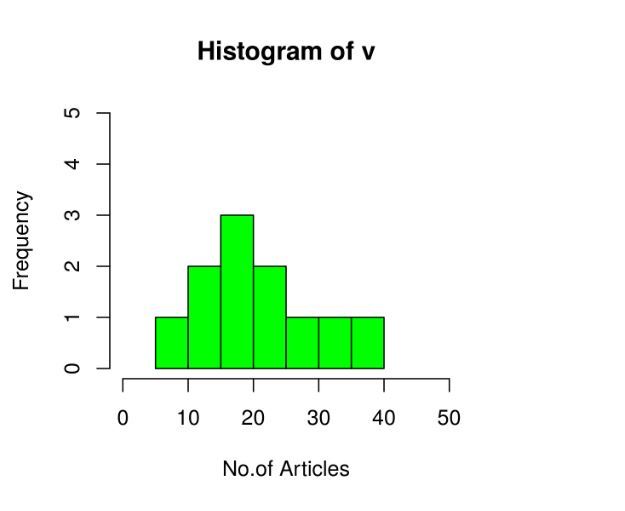
hist(v, xlab = "No.of Articles", col = "green",
    border = "black", xlim = c(0, 50),
    ylim = c(0, 5), breaks = 5)
R
# Creating data for the graph.
v <- c(19, 23, 11, 5, 16, 21, 32, 14, 19,
       27, 39, 120, 40, 70, 90)

# Creating the histogram.
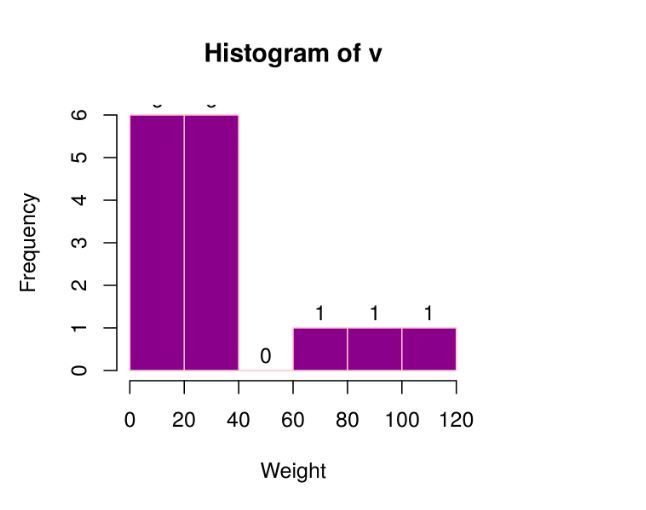
m<-hist(v, xlab = "Weight", ylab ="Frequency",
        col = "darkmagenta", border = "pink",
        breaks = 5)

# Setting labels
text(m$mids, m$counts, labels = m$counts,
     adj = c(0.5, -0.5))
R
# Creating data for the graph.
v <- c(19, 23, 11, 5, 16, 21, 32, 14,
       19, 27, 39, 120, 40, 70, 90)

# Creating the histogram.
hist(v, xlab = "Weight", ylab ="Frequency",
     xlim = c(50, 100),
    col = "darkmagenta", border = "pink",
    breaks = c(5, 55, 60, 70, 75,
               80, 100, 140))
输出:

X 和 Y 值的范围
要描述值的范围,我们需要执行以下步骤:
- 我们可以在 X 轴和 Y 轴上使用 xlim 和 ylim 参数。
- 获取制作直方图所需的所有参数。
例子
R
# Create data for the graph.
v <- c(19, 23, 11, 5, 16, 21, 32, 14, 19, 27, 39)


# Create the histogram.
hist(v, xlab = "No.of Articles", col = "green",
    border = "black", xlim = c(0, 50),
    ylim = c(0, 5), breaks = 5)
输出:

使用 text() 为标签使用直方图返回值
创建直方图返回值图表。
R
# Creating data for the graph.
v <- c(19, 23, 11, 5, 16, 21, 32, 14, 19,
       27, 39, 120, 40, 70, 90)

# Creating the histogram.
m<-hist(v, xlab = "Weight", ylab ="Frequency",
        col = "darkmagenta", border = "pink",
        breaks = 5)

# Setting labels
text(m$mids, m$counts, labels = m$counts,
     adj = c(0.5, -0.5))
输出:

使用非均匀宽度的直方图
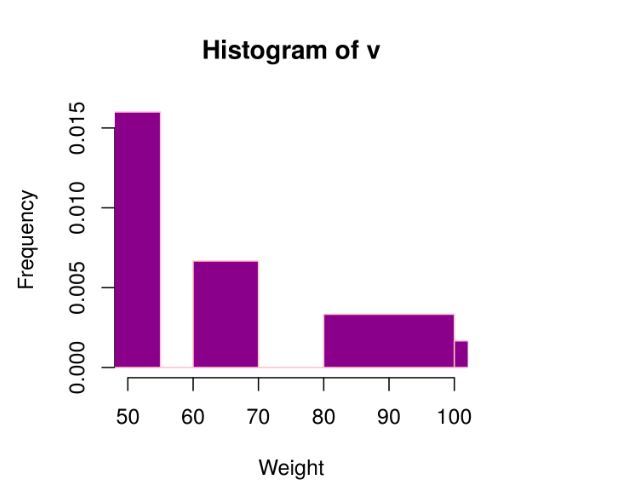
创建不同宽度的直方图图表,通过使用上述参数,我们创建了使用非均匀宽度的直方图。
例子
R
# Creating data for the graph.
v <- c(19, 23, 11, 5, 16, 21, 32, 14,
       19, 27, 39, 120, 40, 70, 90)

# Creating the histogram.
hist(v, xlab = "Weight", ylab ="Frequency",
     xlim = c(50, 100),
    col = "darkmagenta", border = "pink",
    breaks = c(5, 55, 60, 70, 75,
               80, 100, 140))
输出:
