使用 Pandas Group by module 创建非分层列
在本文中,我们将看到在应用groupby模块时创建非分层列的几种方法。
我们正在使用财富 500 强公司数据集来演示问题和解决方案。我们必须从 data.world 网站获取一份副本。
对于每个“部门”和“行业”,找出总员工数、平均员工数以及最小、最大收入变化。
让我们看一个实现的例子:
第 1 步:让我们首先导入 pandas 和以公司“Rank”为索引的数据集。
Python3
import pandas as pd

# load the dataset
df = pd.read_csv(
    "https://raw.githubusercontent.com/sasankac/TestDataSet/master/Fortune500.csv")

# print the columns
print(df.columns)
Python3
# remove unwanted columns
remove_columns =['Website','Hqaddr','Hqzip', 'Hqtel',
                 'Ceo','Ceo-title', 'Address', 'Ticker',
                 'Prftchange', 'Assets', 'Totshequity']

df = df.drop(columns= remove_columns,axis = 1)
print(df.columns)
Python3
df_result = (df
           .groupby(['Sector','Industry'])
           .agg({'Employees':['sum', 'mean'],
                 'Revchange':['min','max']}))

# printing top 15 rows
df_result.head(15)
Python3
df_result.columns = ['_'.join(cols).lower()
                     for cols in df_result.columns.to_flat_index()]
df_result.head(10)
Python3
"""
 Program: For each "Sector" and "Industry" Find the total, average employees, and the minimum, maximum revenue change.
"""

import pandas as pd

"""
 Function: Convert hierarchial columns to non-hierarchial columns
   params: dataframe with hierarchial columns
  return : dataframe with non-hierarchial columns
"""


def return_non_hierarchial(df):
    df.columns = ['_'.join(x) for x in df.columns.to_flat_index()]
    return df


# load the dataset with rank as index
df = pd.read_csv(
    "https://raw.githubusercontent.com/sasankac/TestDataSet/master/Fortune500.csv", index_col="Rank")

# remove unwanted columns
remove_columns = ['Website', 'Hqaddr', 'Hqzip', 'Hqtel', 'Ceo',
                  'Ceo-title', 'Address', 'Ticker', 'Prftchange',
                  'Assets', 'Totshequity']

df = df.drop(columns=remove_columns, axis=1)

# Identify the data as per the requirement
df_result = (df
             .groupby(['Sector', 'Industry'])
             .agg({'Employees': ['sum', 'mean'],
                   'Revchange': ['min', 'max']})
             .astype(int)
             .pipe(return_non_hierarchial))

# print the data
df_result.head(15)
Python3
"""
 Program: For each "Sector" and "Industry" Find the total, average employees, and the minimum, maximum revenue change.
"""

import pandas as pd

# load the dataset with rank as index
df = pd.read_csv(
    "https://raw.githubusercontent.com/sasankac/TestDataSet/master/Fortune500.csv", index_col="Rank")

# remove unwanted columns
remove_columns = ['Website', 'Hqaddr', 'Hqzip', 'Hqtel', 'Ceo',
                  'Ceo-title', 'Address', 'Ticker', 'Prftchange',
                  'Assets', 'Totshequity']

df = df.drop(columns=remove_columns, axis=1)

# Identify the data as per the requirement
df_result = (df
             .groupby(['Sector', 'Industry'])
             .agg(Employees_sum=pd.NamedAgg(column='Employees', aggfunc='sum'),
                  Employees_average=pd.NamedAgg(
                      column='Employees', aggfunc='mean'),
                  Revchange_minimum=pd.NamedAgg(
                      column='Revchange', aggfunc='min'),
                  Revchange_maximum=pd.NamedAgg(column='Revchange', aggfunc='max'))
             .astype(int))

# print the data
df_result.head(15)
输出:

第 2 步:数据集中有很多我们不感兴趣的列,例如总部位置、地址……我将从数据集中删除它们。
蟒蛇3
# remove unwanted columns
remove_columns =['Website','Hqaddr','Hqzip', 'Hqtel',
                 'Ceo','Ceo-title', 'Address', 'Ticker',
                 'Prftchange', 'Assets', 'Totshequity']

df = df.drop(columns= remove_columns,axis = 1)
print(df.columns)
输出:

方法一:
在此方法中,我们将使用to_flat_index方法输出非分层列。让我,第一组,列来识别下面的数据。对于每个“部门”和“行业”,找出总员工数、平均员工数以及最小、最大收入变化。 groupby和aggregation的语法如下
Syntax: df.groupby([‘grouping column1′,’ grouping column2”]).agg({ ‘aggregate column1’ :[‘aggregate function1′,’aggregate function2’] })
Now as per the requirement let us map the column names from the data set to the syntax.
- Grouping columns – ‘Sector’, ‘Industry’
- Aggregate columns – ‘Employees’, ‘Revchange’
- Aggregate functions – ‘sum’, ‘mean’, ‘min’ ”max3. Getting the results by applying the above syntax.
执行:
蟒蛇3
df_result = (df
           .groupby(['Sector','Industry'])
           .agg({'Employees':['sum', 'mean'],
                 'Revchange':['min','max']}))

# printing top 15 rows
df_result.head(15)
输出:

查看结果,我们有 6 个分层列,即员工的总和和平均值(以黄色突出显示)和最小、最大列用于 Revchange。我们可以使用 pandas 0.24 版本中引入的 .to_flat_index 方法将分层列转换为非分层列。
蟒蛇3
df_result.columns = ['_'.join(cols).lower()
                     for cols in df_result.columns.to_flat_index()]
df_result.head(10)
输出:
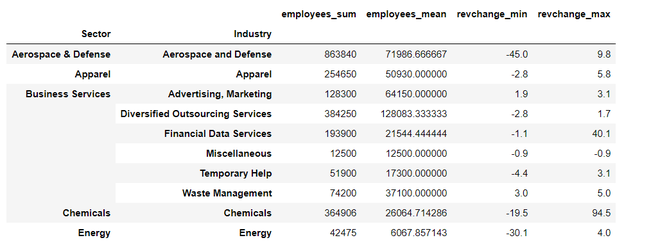
成功应用该函数后,所有列都不会以列名附加聚合函数进行展平。
全面实施:
蟒蛇3
"""
 Program: For each "Sector" and "Industry" Find the total, average employees, and the minimum, maximum revenue change.
"""

import pandas as pd

"""
 Function: Convert hierarchial columns to non-hierarchial columns
   params: dataframe with hierarchial columns
  return : dataframe with non-hierarchial columns
"""


def return_non_hierarchial(df):
    df.columns = ['_'.join(x) for x in df.columns.to_flat_index()]
    return df


# load the dataset with rank as index
df = pd.read_csv(
    "https://raw.githubusercontent.com/sasankac/TestDataSet/master/Fortune500.csv", index_col="Rank")

# remove unwanted columns
remove_columns = ['Website', 'Hqaddr', 'Hqzip', 'Hqtel', 'Ceo',
                  'Ceo-title', 'Address', 'Ticker', 'Prftchange',
                  'Assets', 'Totshequity']

df = df.drop(columns=remove_columns, axis=1)

# Identify the data as per the requirement
df_result = (df
             .groupby(['Sector', 'Industry'])
             .agg({'Employees': ['sum', 'mean'],
                   'Revchange': ['min', 'max']})
             .astype(int)
             .pipe(return_non_hierarchial))

# print the data
df_result.head(15)
输出:

方法二:
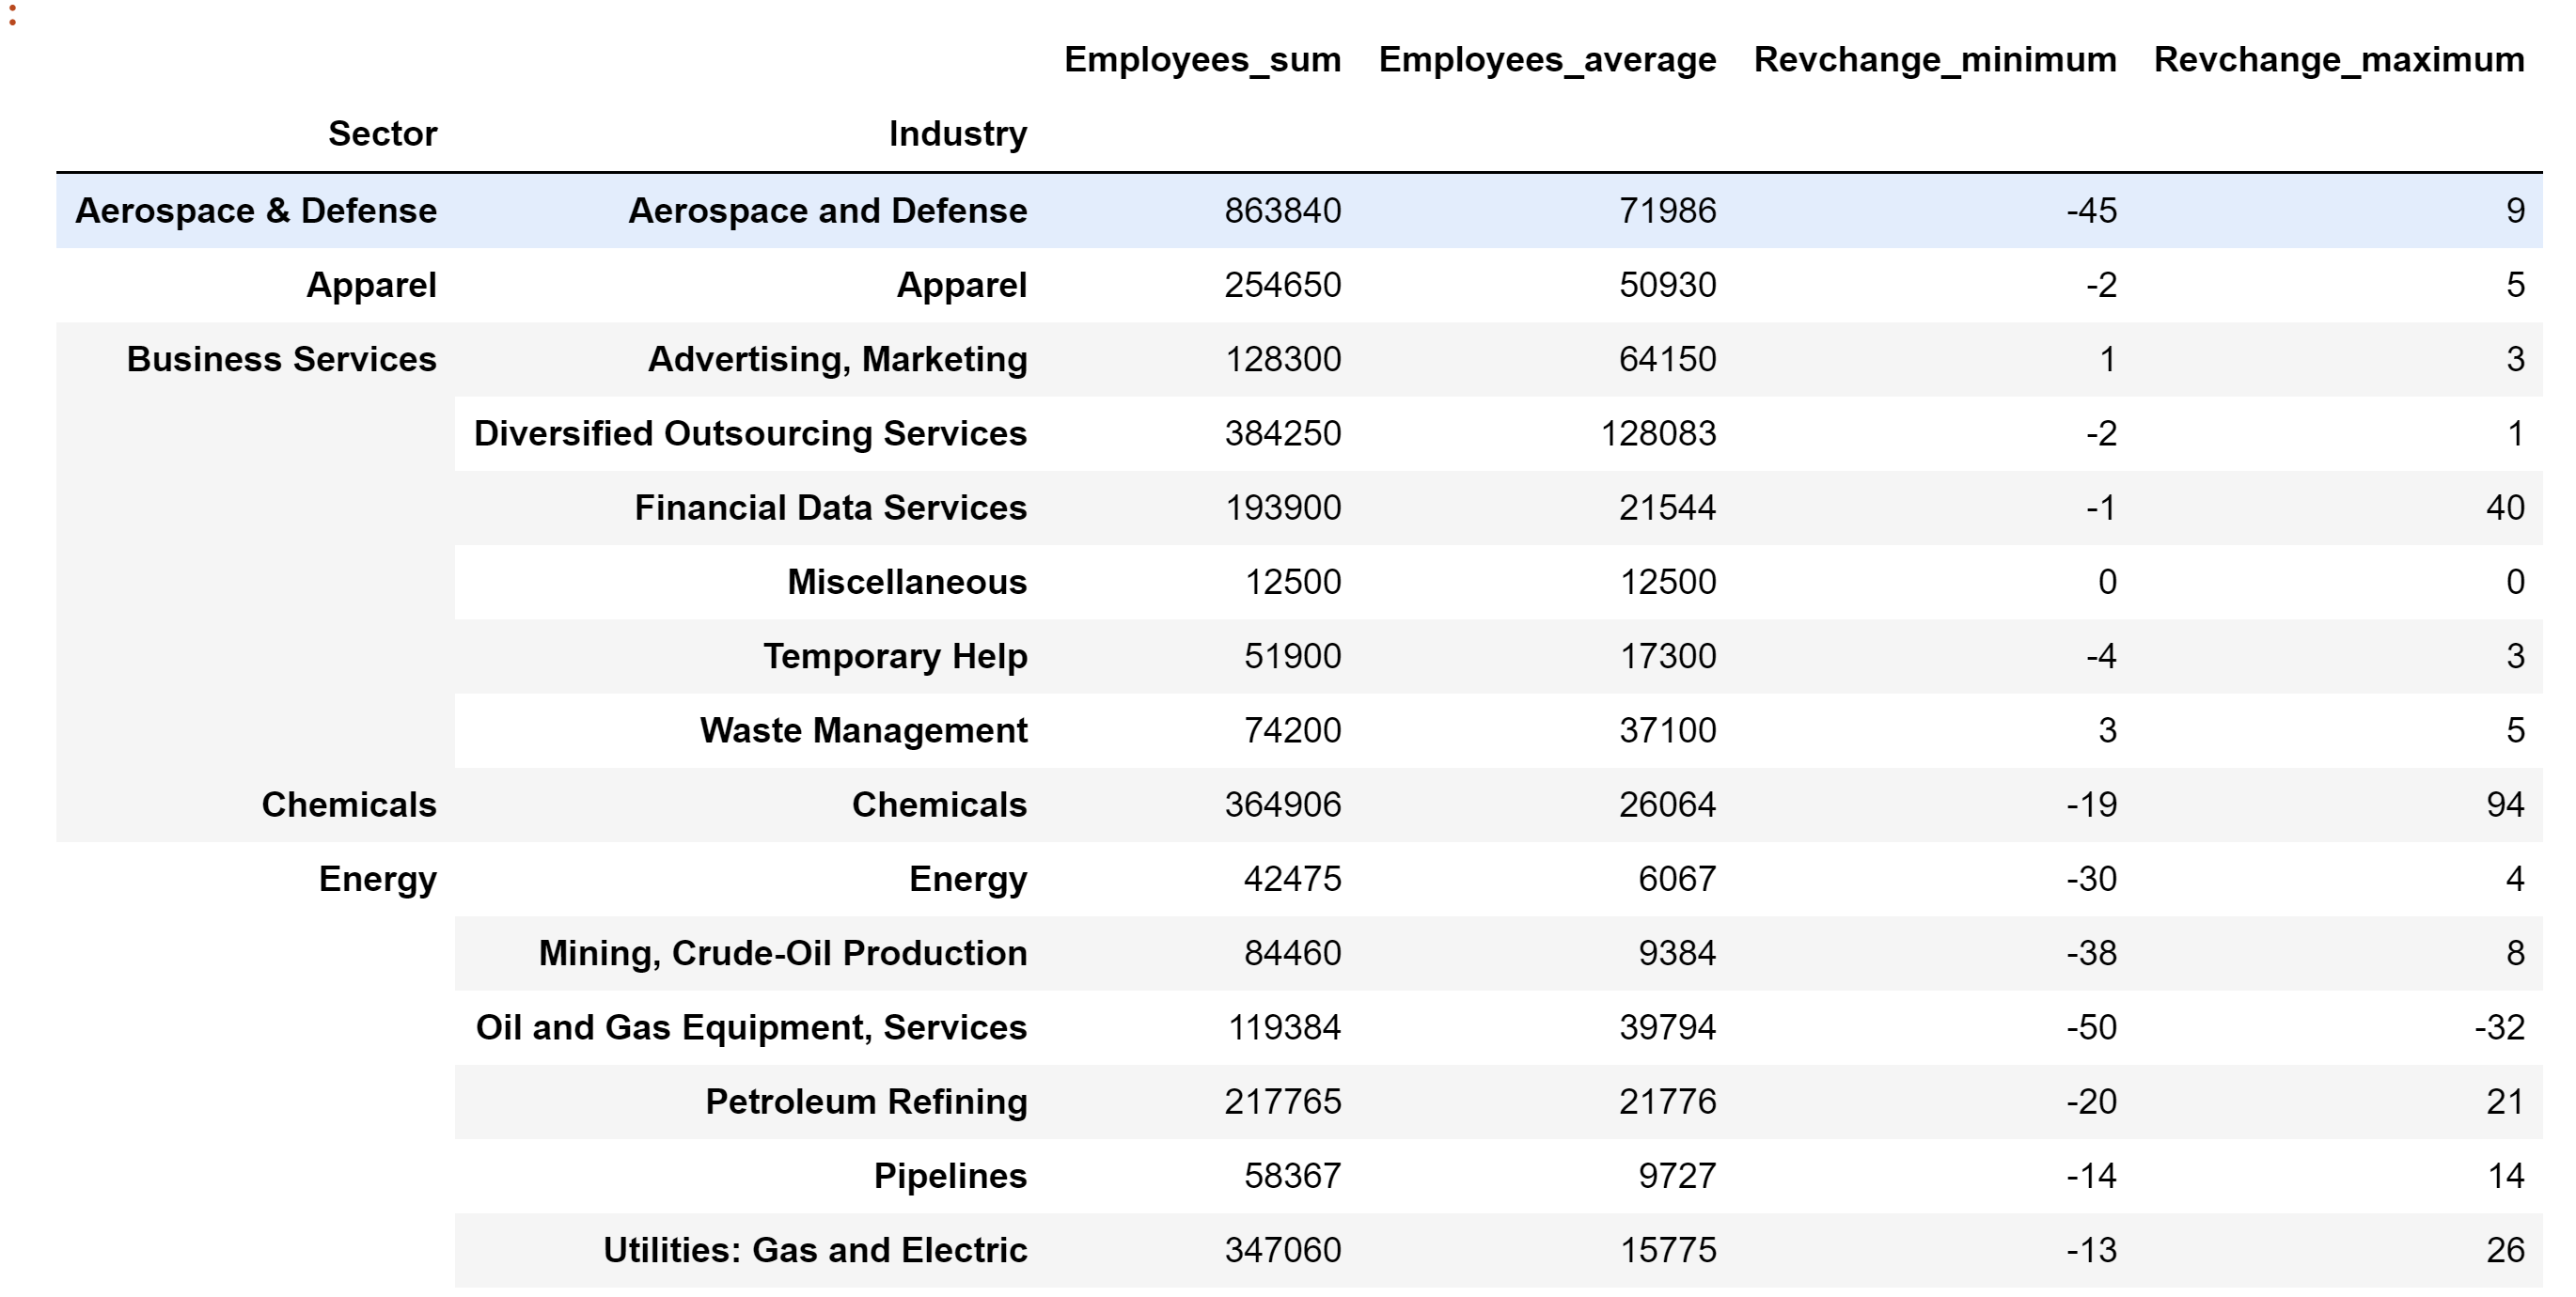
Pandas 引入了命名聚合对象来创建非分层列。我将使用上述相同的要求并将其应用于命名聚合。
此 groupby 方法的语法如下:
df.groupby([‘grouping column1′,’ grouping column2”]).agg({ ‘Named column’ = NamedAgg(column=’aggregate column’, aggfunc=’aggregate function’))
执行:
蟒蛇3
"""
 Program: For each "Sector" and "Industry" Find the total, average employees, and the minimum, maximum revenue change.
"""

import pandas as pd

# load the dataset with rank as index
df = pd.read_csv(
    "https://raw.githubusercontent.com/sasankac/TestDataSet/master/Fortune500.csv", index_col="Rank")

# remove unwanted columns
remove_columns = ['Website', 'Hqaddr', 'Hqzip', 'Hqtel', 'Ceo',
                  'Ceo-title', 'Address', 'Ticker', 'Prftchange',
                  'Assets', 'Totshequity']

df = df.drop(columns=remove_columns, axis=1)

# Identify the data as per the requirement
df_result = (df
             .groupby(['Sector', 'Industry'])
             .agg(Employees_sum=pd.NamedAgg(column='Employees', aggfunc='sum'),
                  Employees_average=pd.NamedAgg(
                      column='Employees', aggfunc='mean'),
                  Revchange_minimum=pd.NamedAgg(
                      column='Revchange', aggfunc='min'),
                  Revchange_maximum=pd.NamedAgg(column='Revchange', aggfunc='max'))
             .astype(int))

# print the data
df_result.head(15)
输出: