导出散景图
Bokeh 是一个可用于Python的交互式数据可视化库。使用 Bokeh,我们可以将我们的绘图嵌入到任何 HTML 文件中。它在内部使用 HTML 和 JavaScript 在 Web 浏览器中渲染绘图以进行表示。在后台,它将数据源转换为 JSON 文件,该文件用作 BokehJS(一个 JavaScript 库)的输入,并在现代浏览器中呈现可视化效果。在本文中,我们将看到如何将散景图导出/保存到本地存储。
我们需要以下依赖项来导出散景图:
- Selenium
- 网络驱动程序
要使用 conda 安装这两个,请依次运行以下命令:
conda install selenium geckodriver -c conda-forge
conda install selenium python-chromedriver-binary -c conda-forge
使用点子:
pip install selenium geckodriver firefox方法 1:使用 export_png()函数将绘图保存为 PNG
使用 export_png()函数,我们可以直接从Python代码中将绘图导出为 PNG 图像。
Syntax: export_png(obj, filename, width, height, webdriver)
Arguments:
- obj: obj can be any plot that we are going to export.
- filename: It is an optional argument, the default plot filename will be the python file name.
- width: It is an optional argument, used to set the width of the exported plot layout obj, by default it will be ignored.
- height: It is an optional argument, used to set the height of the exported plot layout obj, by default it will be ignored.
- webdriver: It is an optional argument, used to set the default web driver instance to use to export the plot. A selenium web driver is by default if we don’t specify anything.
首先,准备要可视化的数据,然后调用 figure()函数以创建具有默认属性(例如标题和轴标签)的图。使用不同种类的渲染器来创建不同种类的绘图。例如,要渲染一个圆,我们可以使用 circle()函数代替 line() 来渲染圆。使用 export_png(plot_obj, filename)函数保存绘图,然后使用 show()函数显示结果绘图。
Python3
# importing necessary libraries
from bokeh.plotting import figure
from bokeh.plotting import output_file
from bokeh.plotting import show
from bokeh.io import export_png

# dummy data
x = [2, 4, 8, 10, 12, 14]
y = [22, 54, 18, 50, 22, 24]

# set output to static HTML file
output_file("line.html")

# Adding plot
fig = figure(
    title="Bokeh Plot",
    x_axis_label='x-axis',
    y_axis_label='y-axis',)

# add a line renderer to plot line
fig.line(x, y)

# saving the plot on disk
print('Exporting bokeh_plot.png.....')
export_png(fig, filename = "bokeh_plot.png")

# displaying plot
show(fig)
Python3
# importing necessary libraries
from bokeh.plotting import figure
from bokeh.plotting import output_file
from bokeh.plotting import show
from bokeh.io import export_svgs


# dummy data
x = [1, 2, 3, 4, 5, 6, 7, 8, 9, 10]
y = [11, 12, 13, 14, 15, 16, 18, 17, 19, 20]

output_file("circle_bokeh.html")

# Adding plot
fig = figure(
    title="SVG Bokeh Plot",
    x_axis_label='x-axis',
    y_axis_label='y-axis',)

# add a circle renderer to plot
fig.circle(x, y, fill_color="green", size=20)

# saving the plot on disk
print('Exporting circle_bokeh.svg.....')
fig.output_backend = "svg"
export_svgs(fig, filename = "circle_bokeh.svg")

# displaying plot
show(fig)
输出:
Exporting bokeh_plot.png....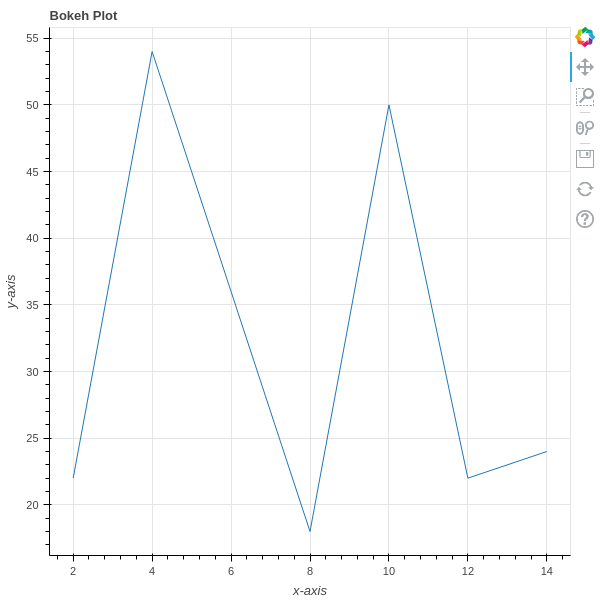
导出为 PNG
方法 2:使用 export_svg()函数将绘图保存为 SVG
使用 bokeh.io 中的 export_svg()函数,我们可以直接从Python代码中将绘图导出为 SVG 图像。
Syntax: export_png(obj, filename, width, height, webdriver, timeout)
Arguments:
- obj: obj can be any plot that we are going to export.
- filename: It is an optional argument, the default plot filename will be the python file name.
- width: It is an optional argument, used to set the width of the exported plot layout obj, by default it will be ignored.
- height: It is an optional argument, used to set the height of the exported plot layout obj, by default it will be ignored.
- webdriver: It is an optional argument, used to set the default web driver instance to use to export the plot. A selenium web driver is by default if we don’t specify anything.
- timeout: The maximum amount of time (in seconds) to wait for Bokeh to initialize. Its default value is 5s.
首先,准备要可视化的数据,然后调用 figure()函数以使用默认属性(例如标题和轴标签)创建绘图。使用不同种类的渲染器创建不同种类的绘图并使用 export_svg(plot_obj, filename)函数保存绘图,然后使用 show()函数显示结果绘图。
蟒蛇3
# importing necessary libraries
from bokeh.plotting import figure
from bokeh.plotting import output_file
from bokeh.plotting import show
from bokeh.io import export_svgs


# dummy data
x = [1, 2, 3, 4, 5, 6, 7, 8, 9, 10]
y = [11, 12, 13, 14, 15, 16, 18, 17, 19, 20]

output_file("circle_bokeh.html")

# Adding plot
fig = figure(
    title="SVG Bokeh Plot",
    x_axis_label='x-axis',
    y_axis_label='y-axis',)

# add a circle renderer to plot
fig.circle(x, y, fill_color="green", size=20)

# saving the plot on disk
print('Exporting circle_bokeh.svg.....')
fig.output_backend = "svg"
export_svgs(fig, filename = "circle_bokeh.svg")

# displaying plot
show(fig)
输出:
Exporting circle_bokeh.svg.....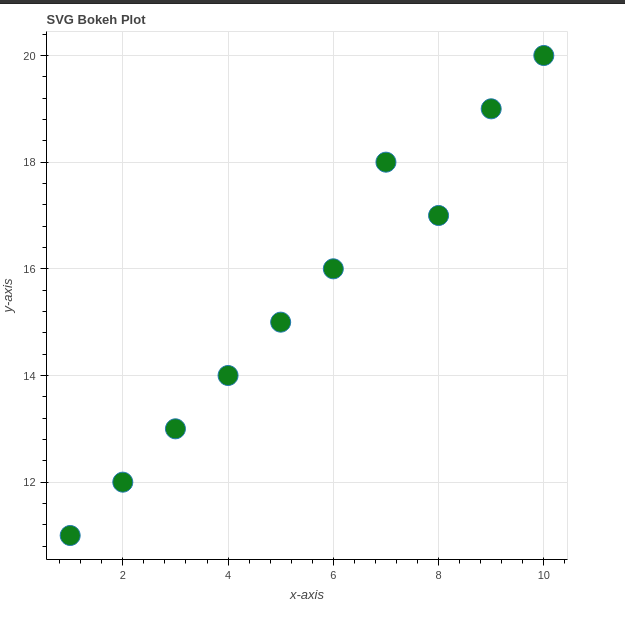
导出为 SVG
注意:导出的绘图将保存在提供Python代码文件的文件夹中。