将交互式滑块添加到散景图中
Bokeh是Python的交互式数据可视化库。它可用于创建交互式绘图、仪表板和数据应用程序。小部件只不过是附加的视觉元素,您可以将其添加到绘图中以交互控制 Bokeh 文档。有各种类型的小部件,例如按钮、div、微调器、滑块等。在本文中,我们将了解散景中的滑块小部件。
滑块小部件
散景滑块可以配置开始和结束值、步长、初始值和标题。基本上,您需要从 bokeh.models 导入 Slider 小部件。
句法:
from bokeh.models import CustomJS, Slider
Slider()函数可用于创建滑块。
Syntax:
Slider(start=0, end=10, value=1, step=.1, title=”Stuff”)
Parameter:
- start: It represents the sliders starting value.
- end:It represents the sliders ending value.
- value: It represents the current value of the slider.
- step: It represents the interval through which the slider moves.
- title: It represents the title of the slider widget.
现在使用 CustomJS 添加回调功能,当 on_change 事件发生时调用它。
句法:
js_on_change(“value”, CustomJS(code=”””…. “””))
js_on_change是一个回调函数,当滑块 on_change 事件发生时调用。 customJS(code=""" """) 表示事件发生后要执行的代码。现在使用滑块对象调用回调函数并创建要在浏览器上显示的所有元素的布局。
示例:使用散景创建滑块
Python
from bokeh.layouts import column
from bokeh.models import ColumnDataSource, Slider, CustomJS
from bokeh.plotting import figure, output_file, show
import numpy as np

x = np.linspace(0, 10, 500)
y = np.sin(x)

source = ColumnDataSource(data=dict(x=x, y=y))

# Create plots and widgets
plot = figure()

plot.line('x', 'y', source=source, line_width=3, line_alpha=0.5)

# Create Slider object
slider = Slider(start=0, end=6, value=2,
                step=0.2, title='Number of points')

# Adding callback code
callback = CustomJS(args=dict(source=source, val=slider),
                    code="""
    const data = source.data;
    const freq = val.value;
    const x = data['x'];
    const y = data['y'];
   for (var i = 0; i < x.length; i++) {
        y[i] = Math.sin(freq*x[i]);
    }

    source.change.emit();
""")

slider.js_on_change('value', callback)

# Arrange plots and widgets in layouts
layout = column(slider, plot)

output_file('exam.html')

show(layout)
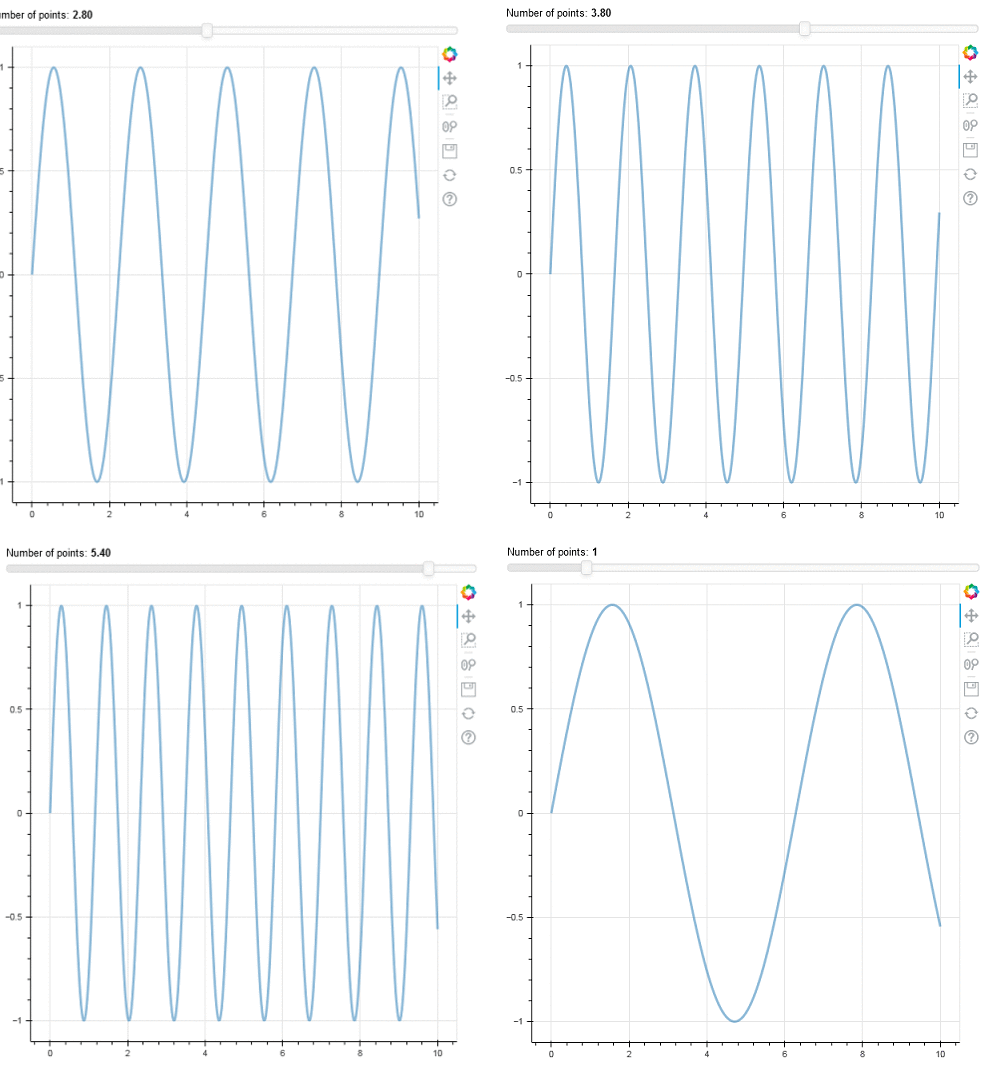
输出:
