在散景图中创建两行图例
在本文中,我们将学习如何在散景图中创建两条线图例。图例是散景图最重要的部分之一。它们帮助我们区分绘图中使用的不同字形。除此之外,如果我们需要在同一个图中绘制不同颜色的不同线条,我们可以使用图例来区分它们。此外,我们可以更改图例中提到的事物的各种属性。
但在深入探讨该主题之前,我们应该使用 google colab 或使用本地设备代码编辑器。如果我们在 google colab 中工作,那么我们可以直接转到下面的实现。但是如果我们使用的是本地设备,那么我们应该确保我们的设备中预装了散景,否则我们也可以安装它。打开命令提示符并写入
pip install bokeh现在,一切都准备好了。在我们的本地设备中安装是必不可少的,否则功能将无法工作。让我们转到上面的实现。
示例 1:
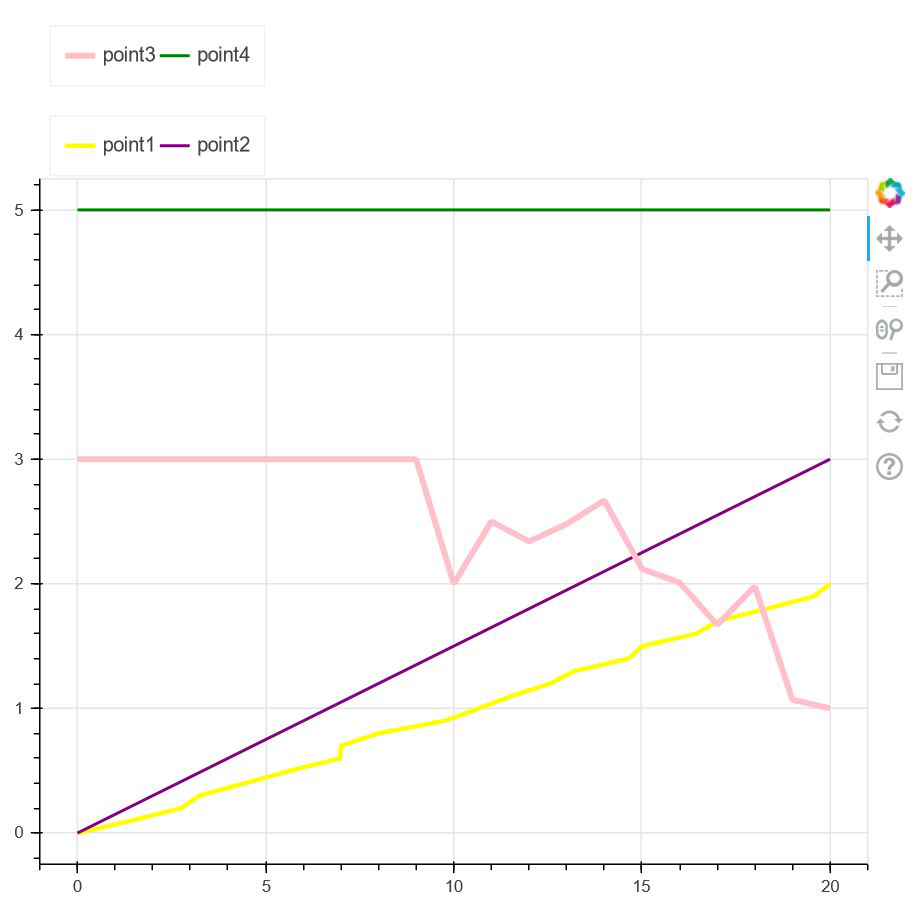
在第一个示例中,我们正在查看一些使用空画布中的各种点绘制的线条。在散景中使用图例我们正在区分线条。这里要注意的主要事情是,我们有一个两行图例。因此,不用再等了,让我们转到代码,看看它是如何工作的。
代码:
Python3
# importing show from
# bokeh.io to show the plot
from bokeh.io import show

# importing legend from bokeh.models
from bokeh.models import Legend

# importing figure from bokeh.plotting
from bokeh.plotting import figure

# importing numpy package from python
import numpy as np

# Creating an empty figure of plot height=600
# and plot width=600
fig = figure(plot_height=600, plot_width=600)

# Creating point1 which is a yellow color line with
# line width as 3 for a set of points
point1 = fig.line(x=[0, 1.43, 2.76, 3.24, 4.45, 5.65,
                     6.98, 7, 8, 9.76, 10.67, 11.54, 12.567,
                     13.21, 14.65, 15, 16.45, 17, 18.32, 19.57, 20],
                  y=np.linspace(0, 2, 21),
                  line_width=3, color="yellow")

# Creating point2 which is a purple color line with
# line width as 2 for a set of points
point2 = fig.line(x=np.linspace(0, 20, 20), y=np.linspace(0, 3, 20),
                  line_width=2, color="purple")

# Creating point3 which is a pink color line with
# line width as 4 for a set of points
point3 = fig.line(x=[0, 1, 2, 3, 4, 5, 6, 7, 8, 9, 10, 11,
                     12, 13, 14, 15, 16, 17, 18, 19, 20],
                  y=[3, 3, 3, 3, 3, 3, 3, 3, 3, 3, 2, 2.5, 2.34,
                     2.48, 2.67, 2.12, 2.01, 1.67, 1.98, 1.07, 1],
                  line_width=4, color="pink")

# Creating point4 which is a green color line with
# line width as 2 for a set of points
point4 = fig.line(x=[0, 20], y=5,
                  line_width=2,
                  color="green")

# Using legend we are placing two point descriptions
# beside each other horizontally
legend1 = Legend(items=[("point1", [point1]),
                        ("point2", [point2])],
                 location=(7, 2), orientation="horizontal")

# Using legend we are placing th other two point
# descriptions beside each other horizontally
legend2 = Legend(items=[("point3", [point3]),
                        ("point4", [point4])],
                 location=(7, 2), orientation="horizontal")

# placing legend1 at the top
fig.add_layout(legend1, 'above')

# placing legend2 at the top
fig.add_layout(legend2, 'above')

# showing the figure
show(fig)
Python3
# importing show from
# bokeh.io to show the plot
from bokeh.io import show

# importing legend from bokeh.models
from bokeh.models import Legend

# importing figure from bokeh.plotting
from bokeh.plotting import figure

# importing numpy package from python
import numpy as np

x1 = [7, 8, 4, 3, 2, 9, 10, 11, 6, 6, 3]
y1 = [10, 11, 12, 13, 14, 15, 16, 17, 18, 19, 20]

# Creating an empty figure of plot height=600
# and plot width=600
fig = figure(plot_height=600, plot_width=600)

# Creating point1 in the form of circular glyphs
# with a set of points
point1 = fig.circle(x=np.arange(14),
                    y=[14, 13, 12, 11, 10, 9, 8, 7,
                       6, 5, 4, 3, 2, 1])

# Creating point2 in the form of triangular glyphs
# with a set of points
point2 = fig.triangle(x=[1, 2, 3, 4, 5, 6, 7, 8, 9, 10, 11,
                         12, 13, 14],

                      y=[1, 4, 9, 16, 25, 36, 49, 64, 81, 100,
                         121, 144, 169, 196], size=30,

                      color="green", alpha=0.5)

# Creating point3 in the form of diamond shaped glyphs
# with a set of points
point3 = fig.diamond(x=[1, 2, 4],
                     y=[20, 19, 1],
                     color="red",
                     alpha=0.4)

# Creating point4 in the form of square shaped glyphs
# with a set of points
point4 = fig.square(x=[70, 80, 40, 30, 20, 10],
                    y=[10, 20, 40, 50, 60, 70],
                    color="red", size=20,
                    alpha=0.6)

# Creating point5 in the form of inverted triangular glyphs
# with a set of points
point5 = fig.inverted_triangle(x=[75, 85, 45, 35, 25, 15],
                               y=[15, 25, 45, 55, 65, 75],
                               color="purple", size=10, alpha=0.6)

# Creating point6 in the form of square shaped glyphs
# with a set of points
point6 = fig.square(x1, y1, color="yellow",
                    size=20, alpha=0.6)

# Using legend we are placing two point descriptions
# beside each other
# horizontally
legend1 = Legend(items=[("point1", [point1]),
                        ("point2", [point2])],
                 location=(10, 10), orientation="horizontal")

# Using legend we are placing th other two point
# descriptions beside each other horizontally
legend2 = Legend(items=[("point3", [point3]), ("point4", [point4])],
                 location=(10, 10), orientation="horizontal")

# Using legend we are placing th other two point
# descriptions beside each other horizontally
legend3 = Legend(items=[("point5", [point5]), ("point6", [point6])],
                 location=(10, 10), orientation="horizontal")

# placing legend1 at the bottom
fig.add_layout(legend1, 'below')

# placing legend2 at the bottom
fig.add_layout(legend2, 'below')

# placing legend3 at the bottom
fig.add_layout(legend3, 'below')

# showing the figure
show(fig)
输出:
解释:
- 在上面的例子中,我们首先从Python提供的 bokeh 库的不同模块中导入所有必需的包,例如 show、figure、Legend 和 numpy。
- 导入包后,我们将创建一个空图,绘图宽度和高度为 600。
- 之后,我们使用不同的点集以及不同的线条颜色和线条宽度创建四个不同的线条。为了识别它们,使用了图例。
- 现在要创建一个两线图例,我们使用两个变量 legend1 和 legend2,其中我们在每个变量中存储两个点,其中我们将方向提供为水平方向。因此,每行将显示两个。
- 使用“ add_layout ”,我们正在确定图例的位置,如上所示,即它将显示在图形表示的顶部。
- 最后,我们使用bokeh.io的节目来展示情节。
示例 2:
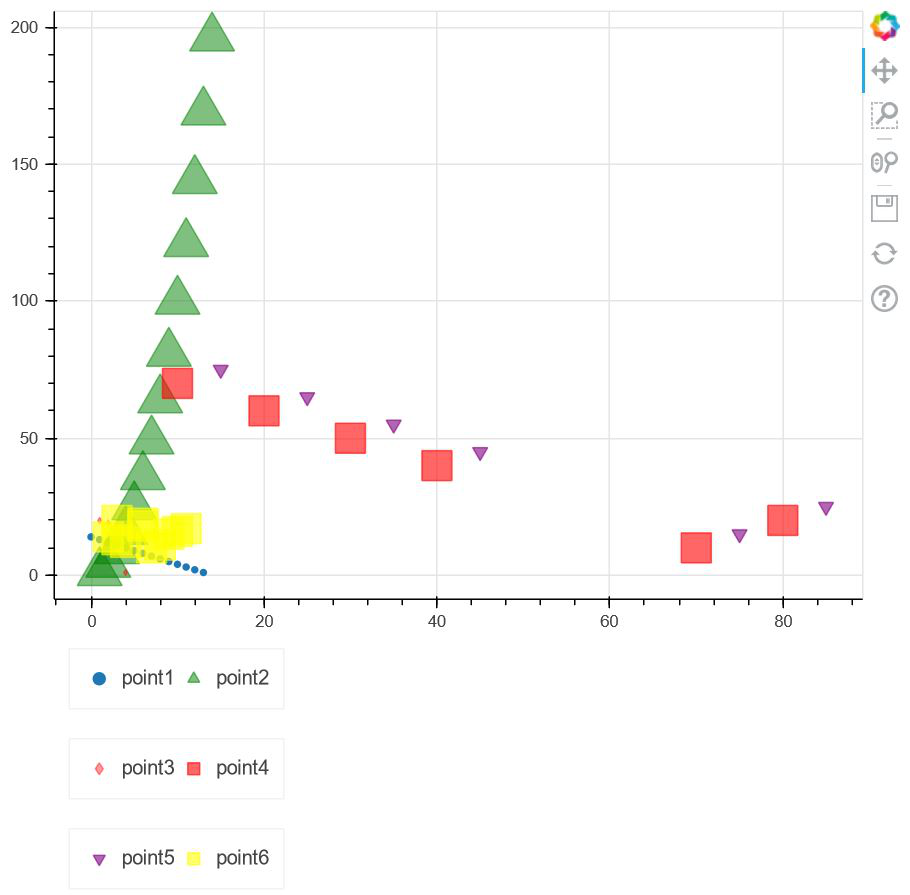
在下一个示例中,我们将使用散景提供的一些字形来探索这个概念。 Bokeh 为我们提供了各种类型的字形,因此我们将实现前面示例中使用的相同概念。
代码:
蟒蛇3
# importing show from
# bokeh.io to show the plot
from bokeh.io import show

# importing legend from bokeh.models
from bokeh.models import Legend

# importing figure from bokeh.plotting
from bokeh.plotting import figure

# importing numpy package from python
import numpy as np

x1 = [7, 8, 4, 3, 2, 9, 10, 11, 6, 6, 3]
y1 = [10, 11, 12, 13, 14, 15, 16, 17, 18, 19, 20]

# Creating an empty figure of plot height=600
# and plot width=600
fig = figure(plot_height=600, plot_width=600)

# Creating point1 in the form of circular glyphs
# with a set of points
point1 = fig.circle(x=np.arange(14),
                    y=[14, 13, 12, 11, 10, 9, 8, 7,
                       6, 5, 4, 3, 2, 1])

# Creating point2 in the form of triangular glyphs
# with a set of points
point2 = fig.triangle(x=[1, 2, 3, 4, 5, 6, 7, 8, 9, 10, 11,
                         12, 13, 14],

                      y=[1, 4, 9, 16, 25, 36, 49, 64, 81, 100,
                         121, 144, 169, 196], size=30,

                      color="green", alpha=0.5)

# Creating point3 in the form of diamond shaped glyphs
# with a set of points
point3 = fig.diamond(x=[1, 2, 4],
                     y=[20, 19, 1],
                     color="red",
                     alpha=0.4)

# Creating point4 in the form of square shaped glyphs
# with a set of points
point4 = fig.square(x=[70, 80, 40, 30, 20, 10],
                    y=[10, 20, 40, 50, 60, 70],
                    color="red", size=20,
                    alpha=0.6)

# Creating point5 in the form of inverted triangular glyphs
# with a set of points
point5 = fig.inverted_triangle(x=[75, 85, 45, 35, 25, 15],
                               y=[15, 25, 45, 55, 65, 75],
                               color="purple", size=10, alpha=0.6)

# Creating point6 in the form of square shaped glyphs
# with a set of points
point6 = fig.square(x1, y1, color="yellow",
                    size=20, alpha=0.6)

# Using legend we are placing two point descriptions
# beside each other
# horizontally
legend1 = Legend(items=[("point1", [point1]),
                        ("point2", [point2])],
                 location=(10, 10), orientation="horizontal")

# Using legend we are placing th other two point
# descriptions beside each other horizontally
legend2 = Legend(items=[("point3", [point3]), ("point4", [point4])],
                 location=(10, 10), orientation="horizontal")

# Using legend we are placing th other two point
# descriptions beside each other horizontally
legend3 = Legend(items=[("point5", [point5]), ("point6", [point6])],
                 location=(10, 10), orientation="horizontal")

# placing legend1 at the bottom
fig.add_layout(legend1, 'below')

# placing legend2 at the bottom
fig.add_layout(legend2, 'below')

# placing legend3 at the bottom
fig.add_layout(legend3, 'below')

# showing the figure
show(fig)
输出:
解释:
- 导入所需的包后,我们将使用两个变量 x1 和 y1 以及稍后要绘制的一组点。
- 之后,我们将绘图宽度和绘图高度设置为 600。 现在,bokeh 为我们提供了多种可用于区分图形中不同绘图的字形。因此,我们将一些字形指向我们绘图中具有广泛点的 6 个这样的图形。
- 指向它们后,我们使用图例来识别每个字形,我们将两个点放在一起,并将它们的方向设为“水平”。
- 现在使用“ add_layout ”选项,我们可以确定图例框的位置。在这种情况下,我们将它放在底部。
- 最后,我们在“ bokeh.io ”中的“ show ”的帮助下显示了该图。