- javafx 图表
- javafx 图表(1)
- JavaFX 面积图表
- JavaFX 面积图表(1)
- 图表中的饼图(1)
- 图表中的饼图
- JavaFX |弧与示例
- JavaFX |弧与示例(1)
- python中的图表(1)
- javascript中的图表(1)
- 图表 js 删除旧图表 - Javascript (1)
- Excel图表-图表元素
- Excel图表-图表元素(1)
- 图表 js 删除旧图表 - Javascript 代码示例
- Excel图表-创建图表(1)
- Excel图表-创建图表
- python代码示例中的图表
- javascript代码示例中的图表
- 图表 js 清除图表 - Javascript (1)
- Excel图表-图表样式(1)
- Excel图表-图表样式
- 图表 js 清除图表 - Javascript 代码示例
- Excel图表-图表过滤器(1)
- Excel图表-图表过滤器
- 反应图表图表标题 - Javascript (1)
- 示例 javafx - Java (1)
- 反应图表图表标题 - Javascript 代码示例
- 角度高图表-3D图表
- 角度高图表-3D图表(1)
📅 最后修改于: 2020-11-14 07:17:50 🧑 作者: Mango
通常,图表是数据的图形表示。有各种图表可以表示数据,例如条形图,饼图,折线图,散点图等。
JavaFX提供对各种饼图和XY图表的支持。在XY平面上表示的图表包括AreaChart,BarChart,BubbleChart,LineChart,ScatterChart,StackedAreaChart,StackedBarChart等。
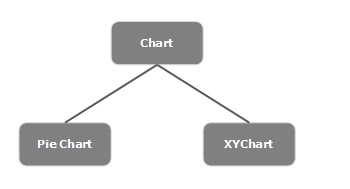
每个图表均由一个类表示,所有这些图表都属于包javafx.scene.chart 。名为Chart的类是JavaFX中所有图表的基类,而XYChart是在XY平面上绘制的所有这些图的基类。
创建图表
要创建图表,您需要-
- 定义图表的轴
- 实例化相应的类
- 准备数据并将其传递到图表
实例化相应的类
要创建图表,请实例化其各自的类。例如,如果要创建折线图,则需要实例化名为Line的类,如下所示:
LineChart linechart = new LineChart(xAxis, yAxis);
如上述代码所示,在实例化时,需要传递两个分别代表图表X和Y轴的对象。
定义轴
通常,图表的轴可以用-表示
- 人口,年龄和
- 类别,例如一周中的天数,国家/地区。
在JavaFX中,轴是代表X或Y轴的抽象类。它有两个子类来定义每种类型的轴,即CategoryAxis和NumberAxis ,如下图所示-

类别轴-通过实例化此类,您可以定义(创建)X或Y轴,每个值都沿该轴表示类别。您可以通过实例化此类来定义类别轴,如下所示:
CategoryAxis xAxis = new CategoryAxis();
对于此轴,您需要将类别列表和标签设置为该轴,如下所示:
//setting the list of categories.
xAxis.setCategories(FXCollections.observableArrayList
   (Arrays.asList("n ame1", "name2"….)));

//Setting label to the axis
xAxis.setLabel("name of the axis ");
NumberAxis-通过实例化此类,您可以定义(创建)X轴或Y轴,每个值沿其表示数值。您可以对此Axis,Long,Double,BigDecimal等使用任何Number类型。可以通过实例化此类来定义Number轴,如下所示:
//Defining the axis
NumberAxis yAxis = new NumberAxis();

//Setting labelto the axis
yAxis.setLabel("name of the axis");
将数据传递到XY图表
所有XY图表均沿XY平面表示。要在图表中绘制一组点,我们需要指定一系列XY坐标。
javafx.scene.chart包的
ObservableList list = series.getData();
其中, series是XYChart.Series类的对象。您可以使用add()方法将数据添加到此列表,如下所示:
list.add(new XYChart.Data(x-axis data, y-axis data));
这两行可以写在一起,如下所示-
series.getData().add(new XYChart.Data(x-axis data, y-axis data));
下表描述了JavaFX提供的各种图表(类)-
| S.No | Chart & Description |
|---|---|
| 1 | Pie Chart
A pie-chart is a representation of values as slices of a circle with different colors. These slices are labeled and the values corresponding to each slice is represented in the chart. In JavaFX, a pie chart is represented by a class named PieChart. This class belongs to the package javafx.scene.chart. |
| 2 | Line Chart
A line chart or line graph displays information as a series of data points (markers) connected by straight line segments. Line Chart shows how the data changes at equal time frequency. In JavaFX, a line chart is represented by a class named LineChart. This class belongs to the package javafx.scene.chart. By instantiating this class, you can create a LineChart node in JavaFX. |
| 3 | Area Chart
Area charts are used to draw area based charts. It plots the area between the given series of points and the axis. In general, this chart is used to compare two quantities. In JavaFX, an Area chart is represented by a class named AreaChart. This class belongs to the package javafx.scene.chart. By instantiating this class, you can create a AreaChart node in JavaFX. |
| 4 | Bar Chart
A bar chart is used to represent grouped data using rectangular bars. The length of these bars depicts the values. The bars in the bar chart can be plotted vertically or horizontally. In JavaFX, a Bar chart is represented by a class named BarChart. This class belongs to the package javafx.scene.chart. By instantiating this class, you can create a BarChart node in JavaFX. |
| 5 |
Bubble Chart
A bubble chart is used to plat three-dimensional data. The third dimension will be represented by the size (radius) of the bubble. In JavaFX, a Bubble chart is represented by a class named BubbleChart. This class belongs to the package javafx.scene.chart. By instantiating this class, you can create a BubbleChart node in JavaFX. |
| 6 | Scatter Chart
A scatterplot is a type of graph which uses values from two variables plotted in a Cartesian plane. It is usually used to find out the relationship between two variables. In JavaFX, a Scatter chart is represented by a class named ScatterChart. This class belongs to the package javafx.scene.chart. By instantiating this class, you can create a ScatterChart node in JavaFX. |
| 7 | Stacked Area Chart
In JavaFX, a Stacked Area chart is represented by a class named StackedAreaChart. This class belongs to the package javafx.scene.chart. By instantiating this class, you can create an StackedAreaChart node in JavaFX. |
| 8 | Stacked Bar Chart
In JavaFX, a Stacked Bar chart is represented by a class named StackedBarChart. This class belongs to the package javafx.scene.chart. By instantiating this class, you can create a StackedBarChart node in JavaFX. |