📌 相关文章
- Highcharts表-配置语法(1)
- Highcharts表-配置语法
- GWT Highcharts-饼图
- GWT Highcharts-饼图(1)
- Angular Highcharts-配置语法
- Angular Highcharts-配置语法(1)
- GWT Highcharts教程
- GWT Highcharts教程(1)
- GWT Highcharts-组合图(1)
- GWT Highcharts-组合图
- 讨论GWT Highcharts(1)
- 讨论GWT Highcharts
- GWT Highcharts-概述
- GWT Highcharts-概述(1)
- GWT Highcharts-地图图(1)
- GWT Highcharts-地图图
- GWT Highcharts-区域图
- GWT Highcharts-条形图(1)
- GWT Highcharts-条形图
- GWT Highcharts-环境设置
- GWT Highcharts-散点图
- GWT Highcharts-散点图(1)
- GWT Highcharts-折线图
- GWT Highcharts-折线图(1)
- GWT Highcharts-有用的资源
- GWT Highcharts-有用的资源(1)
- GWT Highcharts-动态图表
- GWT Highcharts-动态图表(1)
- GWT Highcharts-柱形图
📜 GWT Highcharts-配置语法
📅 最后修改于: 2020-11-16 06:30:58 🧑 作者: Mango
在本章中,我们将展示使用GWT中的Highcharts API绘制图表所需的配置。
步骤1:建立GWT应用程式
请按照以下步骤更新我们在GWT-创建应用程序一章中创建的GWT应用程序–
| Step | Description |
|---|---|
| 1 | Create a project with a name HelloWorld under a package com.tutorialspoint as explained in the GWT – Create Application chapter. |
| 2 | Modify HelloWorld.gwt.xml, HelloWorld.html and HelloWorld.java as explained below. Keep rest of the files unchanged. |
| 3 | Compile and run the application to verify the result of the implemented logic. |
以下是修改后的模块描述符src / com.tutorialspoint / HelloWorld.gwt.xml的内容。
以下是修改后的HTML主机文件war / HelloWorld.html的内容。
GWT Highcharts Showcase
了解配置后,我们将在最后看到更新的HelloWorld.java。
步骤2:创建配置
创建图表
配置图表的类型,标题和副标题。
Chart chart = new Chart()
   .setType(Type.SPLINE)
   .setChartTitleText("Monthly Average Temperature")
   .setChartSubtitleText("Source: WorldClimate.com");
x轴
配置股票代号以显示在X轴上。
XAxis xAxis = chart.getXAxis();
xAxis.setCategories("Jan", "Feb", "Mar", "Apr", "May", "Jun",
   "Jul", "Aug", "Sep", "Oct", "Nov", "Dec");
y轴
配置标题,在Y轴上显示的绘图线。
YAxis yAxis = chart.getYAxis();
yAxis.setAxisTitleText("Temperature °C");
yAxis.createPlotLine()
   .setValue(0)
   .setWidth(1)
   .setColor("#808080");
工具提示
配置工具提示。将后缀添加到值(y轴)之后。
ToolTip toolTip = new ToolTip();
toolTip.setValueSuffix("°C");
chart.setToolTip(toolTip);
传说
配置图例,使其与其他属性一起显示在图表的右侧。
legend.setLayout(Legend.Layout.VERTICAL)
   .setAlign(Legend.Align.RIGHT)
   .setVerticalAlign(Legend.VerticalAlign.TOP)
   .setX(-10)
   .setY(100)
   .setBorderWidth(0);
chart.setLegend(legend);
系列
配置要在图表上显示的数据。系列是一个数组,其中该数组的每个元素代表图表上的一条线。
chart.addSeries(chart.createSeries()
   .setName("Tokyo")
   .setPoints(new Number[] {
      7.0, 6.9, 9.5, 14.5, 18.2, 21.5, 25.2,
      26.5, 23.3, 18.3, 13.9, 9.6
   })
);

chart.addSeries(chart.createSeries()
   .setName("New York")
   .setPoints(new Number[] {
      -0.2, 0.8, 5.7, 11.3, 17.0, 22.0, 24.8,
      24.1, 20.1, 14.1, 8.6, 2.5
   })
);

chart.addSeries(chart.createSeries()
   .setName("Berlin")
   .setPoints(new Number[] {
      -0.9, 0.6, 3.5, 8.4, 13.5, 17.0, 18.6,
      17.9, 14.3, 9.0, 3.9, 1.0
   })
);

chart.addSeries(chart.createSeries()
   .setName("London")
   .setPoints(new Number[] {
      3.9, 4.2, 5.7, 8.5, 11.9, 15.2, 17.0,
      16.6, 14.2, 10.3, 6.6, 4.8
   })
);
步骤3:将图表添加到父面板。
我们将图表添加到根面板。
RootPanel.get().add(chart);
例
考虑以下示例,以进一步了解配置语法-
HelloWorld.java
package com.tutorialspoint.client;

import org.moxieapps.gwt.highcharts.client.Chart;
import org.moxieapps.gwt.highcharts.client.Legend;
import org.moxieapps.gwt.highcharts.client.Series.Type;
import org.moxieapps.gwt.highcharts.client.ToolTip;
import org.moxieapps.gwt.highcharts.client.XAxis;
import org.moxieapps.gwt.highcharts.client.YAxis;

import com.google.gwt.core.client.EntryPoint;
import com.google.gwt.user.client.ui.RootPanel;

public class HelloWorld implements EntryPoint {
   public void onModuleLoad() {
      Chart chart = new Chart()
         .setType(Type.SPLINE)
         .setChartTitleText("Monthly Average Temperature")
         .setChartSubtitleText("Source: WorldClimate.com");

      XAxis xAxis = chart.getXAxis();
      xAxis.setCategories("Jan", "Feb", "Mar", "Apr", "May", "Jun",
         "Jul", "Aug", "Sep", "Oct", "Nov", "Dec");

      YAxis yAxis = chart.getYAxis();
      yAxis.setAxisTitleText("Temperature °C");
      yAxis.createPlotLine()
         .setValue(0)
         .setWidth(1)
         .setColor("#808080");

      ToolTip toolTip = new ToolTip();
      toolTip.setValueSuffix("°C");
      chart.setToolTip(toolTip);

      Legend legend = new Legend();
      legend.setLayout(Legend.Layout.VERTICAL)
         .setAlign(Legend.Align.RIGHT)
         .setVerticalAlign(Legend.VerticalAlign.TOP)
         .setX(-10)
         .setY(100)
         .setBorderWidth(0);
      chart.setLegend(legend);

      chart.addSeries(chart.createSeries()
         .setName("Tokyo")
         .setPoints(new Number[] {
            7.0, 6.9, 9.5, 14.5, 18.2, 21.5, 25.2,
            26.5, 23.3, 18.3, 13.9, 9.6
         })
      );

      chart.addSeries(chart.createSeries()
         .setName("New York")
         .setPoints(new Number[] {
            -0.2, 0.8, 5.7, 11.3, 17.0, 22.0, 24.8,
            24.1, 20.1, 14.1, 8.6, 2.5
         })
      );

      chart.addSeries(chart.createSeries()
         .setName("Berlin")
         .setPoints(new Number[] {
            -0.9, 0.6, 3.5, 8.4, 13.5, 17.0, 18.6,
            17.9, 14.3, 9.0, 3.9, 1.0
         })
      );

      chart.addSeries(chart.createSeries()
         .setName("London")
         .setPoints(new Number[] {
            3.9, 4.2, 5.7, 8.5, 11.9, 15.2, 17.0,
            16.6, 14.2, 10.3, 6.6, 4.8
         })
      );
      RootPanel.get().add(chart);
   }
}
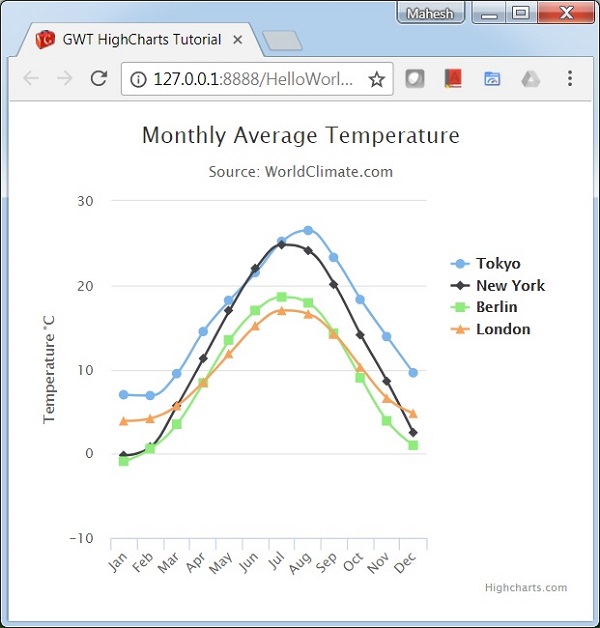
结果
验证结果。