在 R 中创建不同的调色板
在本文中,我们将讨论如何在 R 编程语言中创建一个独特的调色板。在 R 编程中有多种创建调色板的方法,所有这些方法都在下面讨论。
方法一:使用 grDevices 包
我们将使用名为 grDevices 的包,代表图形设备,用于在第一种方法中制作不同的调色板。在这里,我们将使用 grDevices 中的颜色函数来制作我们的调色板。
- 使用颜色()函数:
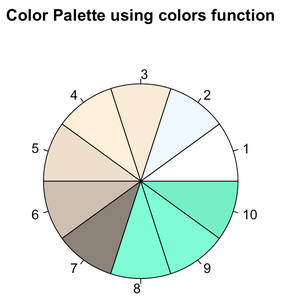
在这个例子中,我们将使用这个包制作饼图。所以,首先我们将提到我们想要在调色板中的颜色数量。然后我们将使用这个包的 colours()函数,它包含广泛的基于 HCL(hue-chroma-luminance) 的颜色。
例子:
R
# number of colors in the palette
no_of_colors <- 10

# applying the colors function from
# grDevices package
color_palette <- grDevices::colors()

# optional, for printing the hex
# color codes
color_palette

# pie function for drawing a pie chart
pie(rep(1, no_of_colors), radius = 0.8,
    col = color_palette,
    main = "Color Palette using colors function")
R
# number of colors in the palette
no_of_colors <- 20

# applying the colors function
color_palette <- grDevices::colors()

# prints all hex color codes
color_palette

# grep command for matching the
# pattern(character string --> green),
palette <- color_palette[grep(
  "green", grDevices::colors())]

# sample colours
green_palette <- sample(palette, no_of_colors)

# the list of the colours, which will
# show up in the palette
green_palette

# shows the created palette
pie(rep(1, no_of_colors), col = green_palette,
    main = "Green and its shades")
R
# no. of colours in the palette
no_of_colors <- 15

# applying the rainbow function
colorful_palette <- rainbow(no_of_colors)

# prints the hex color codes
colorful_palette

# creates a pie chart of rainbow colours
pie(rep(1, no_of_colors), col = colorful_palette,
    main = "Rainbow Palette")
R
# installation of the viridis package
install.packages("viridis")

# loading of the library
library("viridis")

# it may happen that the above 2
# lines of code pops out an error
# saying viridisLite has to loaded
# so to avoid that do load that
# package too
library("viridisLite")

# number of colors in the palette
no_of_colors <- 10

# options represent the color types,
# there are altogether 8 options.
palette <- viridis_pal(option = "D")(no_of_colors)

# hex color codes
palette

# represents colors in a pie chart manner
pie(rep(1, no_of_colors), col = palette, main = "viridis palette")
R
# loading of the library
library("viridis")

# it may happen that the above
# 2 lines of code pops out an
# error saying viridisLite has
# to loaded so to avoid that do
# load that package too
library("viridisLite")

# number of colors in the palette
no_of_colors <- 10

# option A --> magma
palette <- viridis_pal(option = "A")(no_of_colors)

# hex color codes
palette

# represents colors in a pie chart manner
pie(rep(1, no_of_colors), col = palette, main = "magma palette")
R
# installation
install.packages("randomcoloR")
library("randomcoloR")

# no. of colours in the palette
no_of_colors <- 15

# sample colors
palette <- distinctColorPalette(no_of_colors)

# hex color codes
palette

# colors in the pie chart
pie(rep(1, no_of_colors), col = palette,
    main = "palette using randomcoloR package")
R
display.brewer.all(type="seq")R
display.brewer.all(type="div")R
display.brewer.all(type="qual")R
# installation of the package RColorBrewer
install.packages("RColorBrewer")

# loading of the package
library("RColorBrewer")

# extraction of color info
# qual --> Qualitative color palette
palette5 <- brewer.pal.info[brewer.pal.info$category == "qual",]

# create vector with all colors
palette <- unlist(mapply(brewer.pal, palette5$maxcolors,
                         rownames(palette5)))
palette

# sample colors
palette_palette <- sample(palette, no_of_colors)

# colors with their hex codes
palette_palette

# prints the pie chart
pie(rep(1, no_of_colors), col = palette_palette,
    main = "RColorBrewer Palette")
输出:
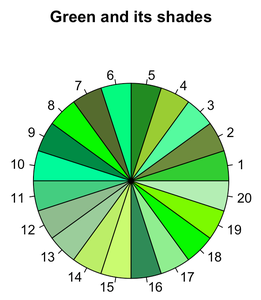
现在,假设我们希望创建一个仅包含绿色及其色调的 coloraturas 调色板。我们也将像往常一样遵循上述步骤来制作这个调色板,但唯一的变化是,我们将在这里使用 grep 命令。 grep 用于在字符向量的每个元素中搜索或匹配参数模式:它们的格式和结果中的细节数量不同。
句法:
grep(pattern, x, ignore.case = FALSE, perl = FALSE, value = FALSE, fixed = FALSE, useBytes = FALSE, invert = FALSE)
例子:
电阻
# number of colors in the palette
no_of_colors <- 20

# applying the colors function
color_palette <- grDevices::colors()

# prints all hex color codes
color_palette

# grep command for matching the
# pattern(character string --> green),
palette <- color_palette[grep(
  "green", grDevices::colors())]

# sample colours
green_palette <- sample(palette, no_of_colors)

# the list of the colours, which will
# show up in the palette
green_palette

# shows the created palette
pie(rep(1, no_of_colors), col = green_palette,
    main = "Green and its shades")
输出:
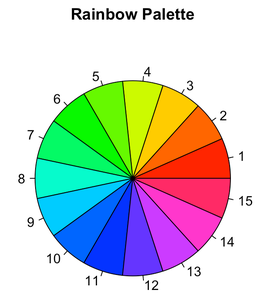
- 使用彩虹()
在这里,我们将使用 grDevices 包中的 Rainbow()函数制作调色板。 Rainbow()函数是一个内置的调色板,可用于根据参数立即生成一些所需长度的颜色向量,并返回可用颜色的十六进制代码。
句法:
rainbow(variable name which stores the number of colors)
整个过程和之前一样,只是我们这里用的是彩虹函数。
例子:
电阻
# no. of colours in the palette
no_of_colors <- 15

# applying the rainbow function
colorful_palette <- rainbow(no_of_colors)

# prints the hex color codes
colorful_palette

# creates a pie chart of rainbow colours
pie(rep(1, no_of_colors), col = colorful_palette,
    main = "Rainbow Palette")
输出
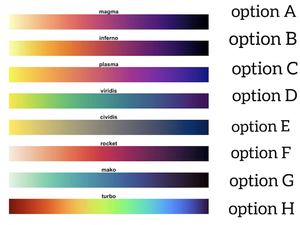
方法二:使用viridis包。
Viridis 包是一个默认的颜色映射。这是一系列彩色地图,专门设计用于提高具有常见色觉缺陷或色盲的人的图形可读性。
这个特定的包由 8 个色阶组成:“viridis”,即主题名称,以及其他具有类似属性的选项,如下所列。
-> “magma”, –> option A
->“inferno”, –> option B
->“plasma”, –> option C
-> “viridis” –> default option D
->“cividis”, –> option E
-> “rocket”, –> option F
-> “mako”, –> option G
-> “turbo” –> option H
这个 viridis 比例是为了更好地理解颜色类型,提到了他们的选项。
句法:
viridis_pal(option = “option”)(variable storing the number of colors)
例子:
电阻
# installation of the viridis package
install.packages("viridis")

# loading of the library
library("viridis")

# it may happen that the above 2
# lines of code pops out an error
# saying viridisLite has to loaded
# so to avoid that do load that
# package too
library("viridisLite")

# number of colors in the palette
no_of_colors <- 10

# options represent the color types,
# there are altogether 8 options.
palette <- viridis_pal(option = "D")(no_of_colors)

# hex color codes
palette

# represents colors in a pie chart manner
pie(rep(1, no_of_colors), col = palette, main = "viridis palette")
输出:

此外,如果我们希望更改此调色板的颜色模式类型,则需要更改选项(A 到 H 中的任何内容)。除了选项之外,上述代码的每一部分都将保持不变。
例子:
电阻
# loading of the library
library("viridis")
# it may happen that the above
# 2 lines of code pops out an
# error saying viridisLite has
# to loaded so to avoid that do
# load that package too
library("viridisLite")
# number of colors in the palette
no_of_colors <- 10
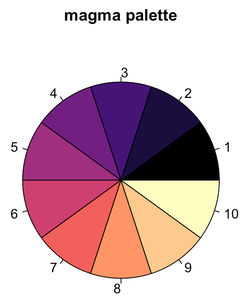
# option A --> magma
palette <- viridis_pal(option = "A")(no_of_colors)
# hex color codes
palette
# represents colors in a pie chart manner
pie(rep(1, no_of_colors), col = palette, main = "magma palette")
输出:
方法 3:使用 randomcoloR 包
randomcoloR 是一个 R 语言包,用于生成有吸引力和独特的颜色。函数distictColorPalette() 生成最佳可识别颜色。
句法:
distictColorPalette(variable having the number of colors stored)
例子:
电阻
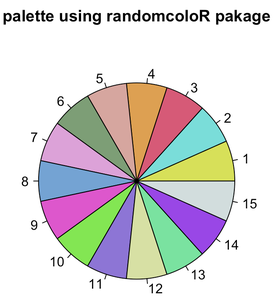
# installation
install.packages("randomcoloR")
library("randomcoloR")

# no. of colours in the palette
no_of_colors <- 15

# sample colors
palette <- distinctColorPalette(no_of_colors)

# hex color codes
palette

# colors in the pie chart
pie(rep(1, no_of_colors), col = palette,
    main = "palette using randomcoloR package")
输出:
方法 4:使用 RColorBrewer 包
这个包创建了漂亮的调色板,特别是对于专题地图。
- brewer.pal()使 ColorBrewer 的调色板可用作 R 调色板。
Syntax:
brewer.pal(n, name)
Parameter:
- n: Number of different colors in the palette, minimum 3, maximum depending on palette.
- name: A palette name from the lists below.
- display.brewer.pal()在图形窗口中显示选定的调色板。
Syntax:
display.brewer.pal(n, name)
Parameter:
- n: Number of different colors in the palette, minimum 3, maximum depending on palette.
- name: A palette name from the lists below.
- display.brewer.all()在图形窗口中同时显示几个调色板。
Syntax:
display.brewer.all(n=NULL, type=”all”, select=NULL, exact.n=TRUE, colorblindFriendly=FALSE)
Parameter:
- n: Number of different colors in the palette, minimum 3, maximum depending on palette.
- name: A palette name from the lists below.
- type: One of the string “div”, “qual”, “seq”, or “all”.
- select: A list of names of existing palettes
- exact.n: If TRUE, only display palettes with a color number given by n.
- colorblindFriendly: if TRUE, display only colorblind friendly palettes.
- brewer.pal.info将有关可用调色板的信息作为数据框返回。 brewer.pal.info 不是函数,它是一个变量。这在未来可能会改变。
- rownames检索或设置类似矩阵的对象的行或列名称。
句法:
rownames(x) <- value
调色板有 3 种类型,即:顺序调色板、发散调色板和定性调色板。
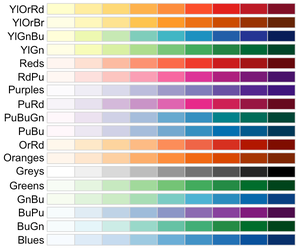
- 顺序调色板适用于从低到高的有序数据。亮度步骤在这些方案的外观中占主导地位,浅色代表低数据值,深色代表高数据值。
电阻
display.brewer.all(type="seq")
输出:
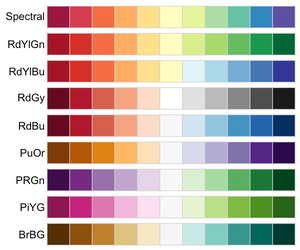
- 发散调色板同样强调数据范围两端的中间临界值和极值。图例中间的临界等级或中断用浅色强调,低和高极端用具有对比色调的深色强调。
电阻
display.brewer.all(type="div")
输出:
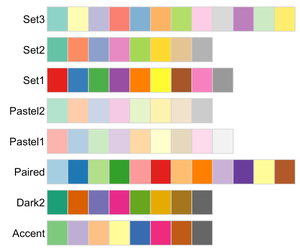
- 定性调色板并不意味着图例类之间的大小差异,色调用于创建类之间的主要视觉差异。定性方案最适合表示名义或分类数据。
电阻
display.brewer.all(type="qual")
输出:
例子:
电阻
# installation of the package RColorBrewer
install.packages("RColorBrewer")
# loading of the package
library("RColorBrewer")
# extraction of color info
# qual --> Qualitative color palette
palette5 <- brewer.pal.info[brewer.pal.info$category == "qual",]
# create vector with all colors
palette <- unlist(mapply(brewer.pal, palette5$maxcolors,
rownames(palette5)))
palette
# sample colors
palette_palette <- sample(palette, no_of_colors)
# colors with their hex codes
palette_palette
# prints the pie chart
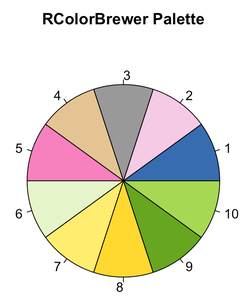
pie(rep(1, no_of_colors), col = palette_palette,
main = "RColorBrewer Palette")
输出:
.