如何处理机器学习项目:逐步指导
本文将提供有关初学者应如何处理机器学习项目的基本过程,并描述所涉及的基本步骤。在问题中,我们将重点关注鸢尾花的分类。您可以在此处了解数据集。
许多教师和网站采用这个问题来展示机器学习项目中涉及的各种细微差别,因为 -
- 所有属性都是数字,所有属性都具有相同的比例和单位。
- 手头的问题是一个分类问题,因此我们可以选择探索许多评估指标。
- 所涉及的数据集小而干净,因此可以轻松处理。
我们演示了以下步骤,并在此过程中相应地描述了它们。
第 1 步:导入所需的库
Python3
import pandas as pd
from pandas.plotting import scatter_matrix
import matplotlib.pyplot as plt
from sklearn import model_selection
from sklearn.metrics import classification_report, confusion_matrix, accuracy_score
from sklearn.linear_model import LogisticRegression
from sklearn.tree import DecisionTreeClassifier
from sklearn.neighbors import KNeighborsClassifier
Python3
# dataset (csv file) path
url = "https://raw.githubusercontent.com /jbrownlee/Datasets/master/iris.csv"

# selectng necessary feature
features = ['sepal-length', 'sepal-width', 'petal-length', 'petal-width', 'class']

# reading the csv
data = pd.read_csv(url, names = features)
Python3
data.head()Python3
data.shapePython3
print(data.describe())Python3
print((data.groupby('class')).size())Python3
data.plot(kind ='box', subplots = True, layout =(2, 2),
                       sharex = False, sharey = False)

plt.show()
Python3
data.hist()
plt.show()
Python3
scatter_matrix(data)
plt.show()
Python3
y = data['class']
X = data.drop('class', axis = 1)
X_train, X_test, y_train, y_test = model_selection.train_test_split(
                           X, y, test_size = 0.25, random_state = 0)

print(X.head())
print('')
print(y.head())
Python3
algorithms = []
scores = []
names = []

algorithms.append(('Logistic Regression', LogisticRegression()))
algorithms.append(('K-Nearest Neighbours', KNeighborsClassifier()))
algorithms.append(('Decision Tree Classifier', DecisionTreeClassifier()))

for name, algo in algorithms:
    k_fold = model_selection.KFold(n_splits = 10, random_state = 0)

    # Applying k-cross validation
    cvResults = model_selection.cross_val_score(algo, X_train, y_train,
                                      cv = k_fold, scoring ='accuracy')

    scores.append(cvResults)
    names.append(name)
    print(str(name)+' : '+str(cvResults.mean()))
Python3
fig = plt.figure()
fig.suptitle('Algorithm Comparison')
ax = fig.add_subplot(111)
plt.boxplot(scores)
ax.set_xticklabels(names)
plt.show()
Python3
for name, algo in algorithms:
    clf = algo
    clf.fit(X_train, y_train)
    y_pred = clf.predict(X_test)
    pred_score = accuracy_score(y_test, y_pred)

    print(str(name)+' : '+str(pred_score))
    print('')
    print('Confusion Matrix: '+str(confusion_matrix(y_test, y_pred)))
    print(classification_report(y_test, y_pred))
第 2 步:加载数据
Python3
# dataset (csv file) path
url = "https://raw.githubusercontent.com /jbrownlee/Datasets/master/iris.csv"

# selectng necessary feature
features = ['sepal-length', 'sepal-width', 'petal-length', 'petal-width', 'class']

# reading the csv
data = pd.read_csv(url, names = features)
第 3 步:汇总数据
此步骤通常涉及以下步骤-
a) 查看数据
Python3
data.head()

b) 查找数据的维度
Python3
data.shape

c)统计汇总所有属性
Python3
print(data.describe())

d)数据的类别分布
Python3
print((data.groupby('class')).size())

第 4 步:可视化数据
此步骤通常涉及以下步骤 -
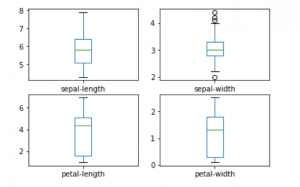
a) 绘制单变量图
这样做是为了了解每个属性的性质。
Python3
data.plot(kind ='box', subplots = True, layout =(2, 2),
                       sharex = False, sharey = False)

plt.show()

Python3
data.hist()
plt.show()

b) 绘制多元图
这样做是为了了解不同特征之间的关系。
Python3
scatter_matrix(data)
plt.show()

第 5 步:训练和评估我们的模型
此步骤通常包含以下步骤 -
a) 拆分训练和测试数据
这样做是为了使部分数据对学习算法隐藏
Python3
y = data['class']
X = data.drop('class', axis = 1)
X_train, X_test, y_train, y_test = model_selection.train_test_split(
                           X, y, test_size = 0.25, random_state = 0)

print(X.head())
print('')
print(y.head())

b) 建立和交叉验证模型
Python3
algorithms = []
scores = []
names = []

algorithms.append(('Logistic Regression', LogisticRegression()))
algorithms.append(('K-Nearest Neighbours', KNeighborsClassifier()))
algorithms.append(('Decision Tree Classifier', DecisionTreeClassifier()))

for name, algo in algorithms:
    k_fold = model_selection.KFold(n_splits = 10, random_state = 0)

    # Applying k-cross validation
    cvResults = model_selection.cross_val_score(algo, X_train, y_train,
                                      cv = k_fold, scoring ='accuracy')

    scores.append(cvResults)
    names.append(name)
    print(str(name)+' : '+str(cvResults.mean()))

c) 直观地比较不同算法的结果
Python3
fig = plt.figure()
fig.suptitle('Algorithm Comparison')
ax = fig.add_subplot(111)
plt.boxplot(scores)
ax.set_xticklabels(names)
plt.show()

第 6 步:做出预测并评估预测
Python3
for name, algo in algorithms:
    clf = algo
    clf.fit(X_train, y_train)
    y_pred = clf.predict(X_test)
    pred_score = accuracy_score(y_test, y_pred)

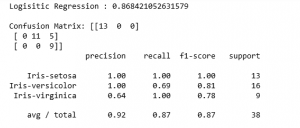
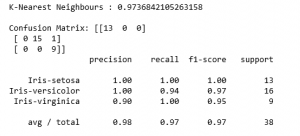
    print(str(name)+' : '+str(pred_score))
    print('')
    print('Confusion Matrix: '+str(confusion_matrix(y_test, y_pred)))
    print(classification_report(y_test, y_pred))


参考 - https://machinelearningmastery.com/machine-learning-in-python-step-by-step/