R语言中的箱线图
箱线图是一种图表,用于通过为每个信息绘制箱线图以分布的形式显示信息。这种数据分布基于五组(最小值、第一四分位数、中位数、第三四分位数、最大值)。
R 编程语言中的箱线图
箱线图是在 R 中使用 boxplot ()函数创建的。
Syntax: boxplot(x, data, notch, varwidth, names, main)
Parameters:
- x: This parameter sets as a vector or a formula.
- data: This parameter sets the data frame.
- notch: This parameter is the label for horizontal axis.
- varwidth: This parameter is a logical value. Set as true to draw width of the box proportionate to the sample size.
- main: This parameter is the title of the chart.
- names: This parameter are the group labels that will be showed under each boxplot.
创建数据集
要了解我们如何创建箱线图:
- 我们使用数据集“mtcars”。
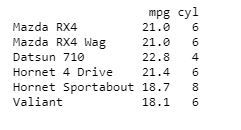
- 让我们看一下 mtcars 中的“mpg”和“cyl”列。
R
input <- mtcars[, c('mpg', 'cyl')]
print(head(input))
R
# Plot the chart.
boxplot(mpg ~ cyl, data = mtcars,
        xlab = "Number of Cylinders",
        ylab = "Miles Per Gallon",
        main = "Mileage Data")
R
set.seed(20000)
data <- data.frame( A = rpois(900, 3),
                    B = rnorm(900),
                    C = runif(900)


)

# Applying boxplot function
boxplot(data)
Python3
# Plot the chart.
boxplot(mpg ~ cyl, data = mtcars,
        xlab = "Number of Cylinders",
        ylab = "Miles Per Gallon",
        main = "Mileage Data",
        notch = TRUE,
        varwidth = TRUE,
        col = c("green", "red", "blue"),
        names = c("High", "Medium", "Low")
        )
输出:

创建箱线图
创建箱线图。
- 获取制作箱线图所需的参数。
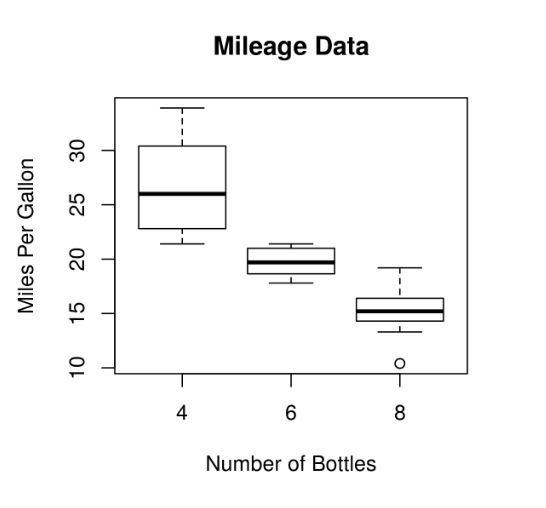
- 现在我们为“mpg”和“cyl”之间的关系绘制图表。
R
# Plot the chart.
boxplot(mpg ~ cyl, data = mtcars,
        xlab = "Number of Cylinders",
        ylab = "Miles Per Gallon",
        main = "Mileage Data")
输出:

多重箱线图
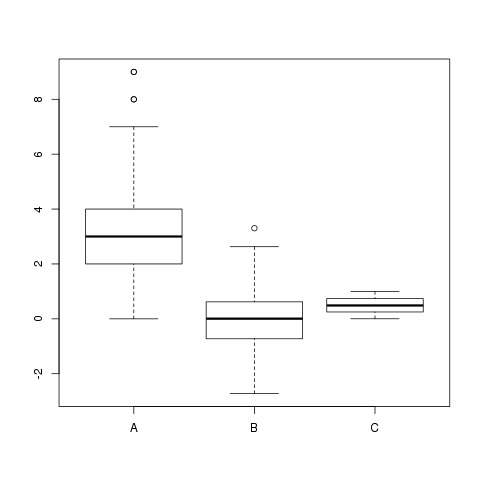
在这里,我们正在创建多个箱线图。需要箱线图表示的单个数据基于函数。
R
set.seed(20000)
data <- data.frame( A = rpois(900, 3),
                    B = rnorm(900),
                    C = runif(900)


)

# Applying boxplot function
boxplot(data)
输出:

使用缺口的箱线图
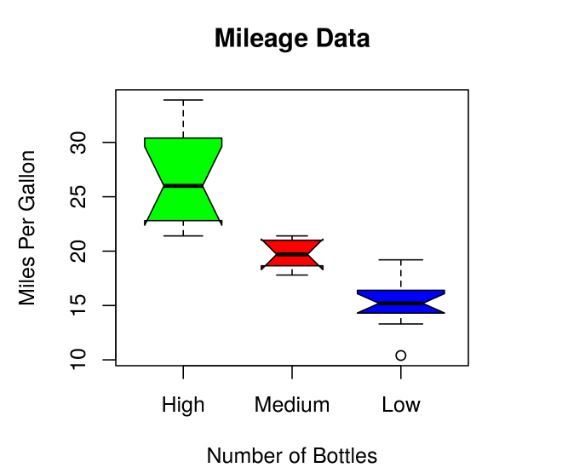
使用缺口绘制箱线图:
- 在notch的帮助下,我们可以找出不同数据组的中位数是如何相互匹配的。
- 我们使用 xlab 作为“气缸数量”,使用 ylab 作为“每加仑英里数”。
Python3
# Plot the chart.
boxplot(mpg ~ cyl, data = mtcars,
        xlab = "Number of Cylinders",
        ylab = "Miles Per Gallon",
        main = "Mileage Data",
        notch = TRUE,
        varwidth = TRUE,
        col = c("green", "red", "blue"),
        names = c("High", "Medium", "Low")
        )
输出:
