📌 相关文章
- R 中带有 ggplot2 的气泡图(1)
- 气泡图 (1)
- Python气泡图(1)
- Python气泡图
- 气泡图 - 任何代码示例
- 气泡排序
- 气泡排序(1)
- python气泡图 - Python(1)
- python气泡图 - Python代码示例
- 气泡排序的C++程序
- 气泡排序的C ++程序(1)
- 气泡排序的C++程序(1)
- 气泡排序的C ++程序
- 气泡排序的C程序
- 气泡排序的C程序(1)
- 气泡排序的C程序(1)
- 气泡排序的C程序
- ggplot2-使用轴(1)
- ggplot2-使用轴
- R中的分类气泡图
- R中的分类气泡图(1)
- R中的3D气泡图(1)
- R中的3D气泡图
- Tableau 中的气泡图(1)
- Tableau-气泡图(1)
- Tableau气泡图(1)
- Tableau 中的气泡图
- Tableau-气泡图
- Tableau气泡图
📜 ggplot2-气泡图和计数图
📅 最后修改于: 2020-12-01 08:44:07 🧑 作者: Mango
气泡图不过是气泡图,它基本上是一个散点图,其中第三个数字变量用于圆的大小。在本章中,我们将重点介绍条形图和直方图图的创建,这些图被视为气泡图的副本。
以下步骤用于使用提到的软件包创建气泡图和计数图-
了解数据集
加载相应的程序包和所需的数据集以创建气泡图和计数图。
> # Load ggplot
> library(ggplot2)
>
> # Read in dataset
> data(mpg)
> head(mpg)
# A tibble: 6 x 11
manufacturer  model  displ  year  cyl  trans      drv   cty  hwy  fl  class

1 audi        a4     1.8    1999  4    auto(l5)   f     18   29   p   compa~
2 audi        a4     1.8    1999  4    manual(m5) f     21   29   p   compa~
3 audi        a4     2      2008  4    manual(m6) f     20   31   p   compa~
4 audi        a4     2      2008  4    auto(av)   f     21   30   p   compa~
5 audi        a4     2.8    1999  6    auto(l5)   f     16   26   p   compa~
6 audi        a4     2.8    1999  6    manual(m5) f     18   26   p   compa~
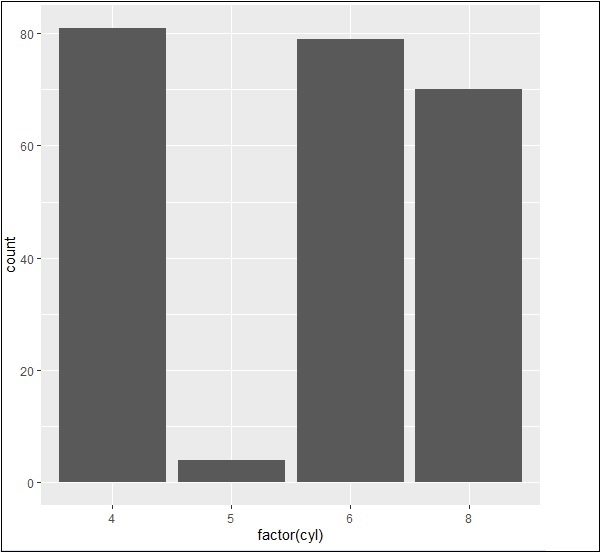
条数图可以使用以下命令创建-
> # A bar count plot
> p  p
直方图分析
可以使用以下命令创建直方图计数图-
> # A historgram count plot
> ggplot(data=mpg, aes(x=hwy)) +
+    geom_histogram( col="red",
+       fill="green",
+       alpha = .2,
+       binwidth = 5)

气泡图
现在,让我们用增加散点图中提到的点的尺寸所需的属性来创建最基本的气泡图。
ggplot(mpg, aes(x=cty, y=hwy, size = pop)) +geom_point(alpha=0.7)
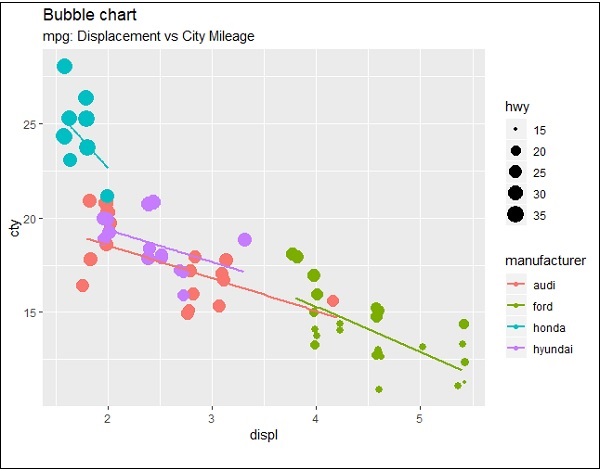
该图以图例格式描述了制造商的性质。表示的值包括“高速公路”属性的各个维度。