更改 R 中图形图例的位置和外观
图例可用于向绘图添加更多信息并增强用户可读性。它涉及标题、索引的创建、绘图框的放置,以便更好地理解绘制的图形。内置的 R函数legend() 可用于向绘图添加图例。散点图、折线图和块图可用于在 R 中轻松可视化数据。在本文中,更改 R 中图形图例的位置和外观
Syntax: legend(x, y, legend)
Arguments :
- x and y : the x and y co-ordinates to be used to position the legend. It can also take string as an argument, like topright, bottomleft and so on..
- legend : vector giving info about each class plotted in the graph
示例 1:更改图例的位置
整数值可以分配给 x 和 y 坐标,并且图例框直接与这些坐标对齐。在这种情况下,有必要提供两个坐标。
代码:
R
# declaring the data to plot
# x coordinate is a vector of
# integers from 1 to 10
x <- 1 : 10
y = x^1/2
z =  x^2

# plotting x and y coordinate line
plot(x, y, col = "blue")

# adding another line on
# the coordinates involving y and z
lines(z, y ,col = "red")

# Adding a legend to the graph
#defining the lines
legend(2, 4, legend=c("Equation 1", "Equation 2"),
       fill = c("blue","red"))
R
# declaring the data to plot
# x coordinate is a vector of
# integers from 1 to 10

x <- 1 : 10
y = x^1/2
z =  x^2

# plotting x and y coordinate
# line
plot(x, y, col = "blue")

# adding another line on the
# coordinates involving y and z
lines(z, y , col = "red")

# Adding a legend to the graph
# defining the lines
legend(x = "topleft", legend=c(
  "Equation 1", "Equation 2"),
       fill = c("blue","red"))
R
# declaring the data to plot
# x coordinate is a vector of
# integers from 1 to 10
x <- 1:10
y = x^1/2
z =  x^2

# plotting x and y coordinate line
plot(x, y, col = "blue")

# adding another line on the
# coordinates involving y and z
lines(z, y ,col = "red")

# Adding a legend to the graph
# defining the lines
legend(x="topleft", legend=c(
  "Equation 1", "Equation 2"),
       fill = c("blue","red"), inset = 0.05)
R
# declaring the data to plot
# x coordinate is a vector of
# integers from 1 to 10
x <- 1:10
y = x^1/2
z = x^2

# plotting x and y coordinate line
plot(x, y, col = "blue")

# adding another line on the
# coordinates involving y and z
lines(z, y , col = "red")

# Adding a legend to the graph
# defining the lines
legend(x = "topleft", box.col = "brown",
       bg ="yellow", box.lwd = 2 , title="EQUATIONS",
       legend=c("Equation 1", "Equation 2"),
       fill = c("blue","red"))
输出:

示例 2:对齐对齐的图例放置。
x 坐标甚至可能包含位置对齐的字符串。该字符串是关键字的组合,其合理值定义为bottomright、bottom、bottomleft、left、topleft、top、topright、right、center。这种情况消除了定义 y 坐标值的需要。
代码:
电阻
# declaring the data to plot
# x coordinate is a vector of
# integers from 1 to 10

x <- 1 : 10
y = x^1/2
z =  x^2

# plotting x and y coordinate
# line
plot(x, y, col = "blue")

# adding another line on the
# coordinates involving y and z
lines(z, y , col = "red")

# Adding a legend to the graph
# defining the lines
legend(x = "topleft", legend=c(
  "Equation 1", "Equation 2"),
       fill = c("blue","red"))
输出

示例 3:留有边距和对齐对齐方式
如果我们以关键字的形式指定位置参数,则图例框会出现连接到相应的轴。为了解决这个问题,可以在这个方法中定义 inset 参数。此参数将距边缘的距离指定为绘图区域的一部分。
代码:
电阻
# declaring the data to plot
# x coordinate is a vector of
# integers from 1 to 10
x <- 1:10
y = x^1/2
z =  x^2

# plotting x and y coordinate line
plot(x, y, col = "blue")

# adding another line on the
# coordinates involving y and z
lines(z, y ,col = "red")

# Adding a legend to the graph
# defining the lines
legend(x="topleft", legend=c(
  "Equation 1", "Equation 2"),
       fill = c("blue","red"), inset = 0.05)
输出:

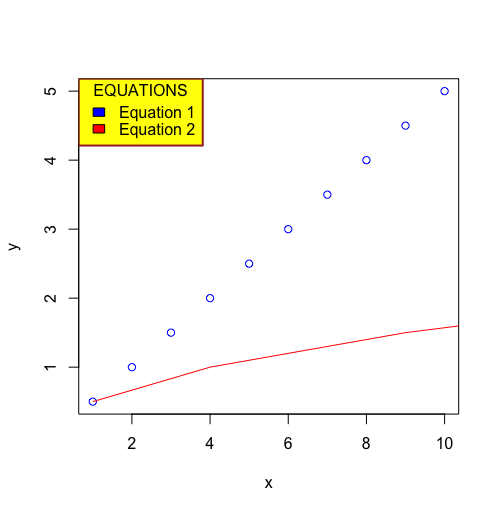
示例 4:图例的颜色外观
可以自定义图表中的图例框以满足要求,以传达更多信息并提供更好的视觉效果。以下参数可用于自定义参数。
- 标题:图例框的标题,可以声明以了解索引表示的内容
- bty (默认: o) :包围图例的框的类型。可以使用不同类型的字母,其中盒子形状等同于字母形状。例如,“n”可用于无框。
- bg:可以为图例框指定背景颜色
- box.lwd : 图例框线宽的指示符
- box.lty : 图例框线型指示符
- box.col :图例框线条颜色的指示符
代码:
电阻
# declaring the data to plot
# x coordinate is a vector of
# integers from 1 to 10
x <- 1:10
y = x^1/2
z = x^2

# plotting x and y coordinate line
plot(x, y, col = "blue")

# adding another line on the
# coordinates involving y and z
lines(z, y , col = "red")

# Adding a legend to the graph
# defining the lines
legend(x = "topleft", box.col = "brown",
       bg ="yellow", box.lwd = 2 , title="EQUATIONS",
       legend=c("Equation 1", "Equation 2"),
       fill = c("blue","red"))
输出: