使用 Pandas 和 Matplotlib 创建棒棒糖图表
在本文中,我们将创建棒棒糖图表。它们只不过是条形图的一种变体,其中粗条被替换为一条线和一个点状的“o”(o 形)。当有大量数据要表示,并且以条形表示时可以形成一个集群时,棒棒糖图表是首选。
链接到 CSV 文件:单击此处
让我们讨论一些使用不同方法的示例,以使用 Pandas 来可视化棒棒糖图表。
示例 1:
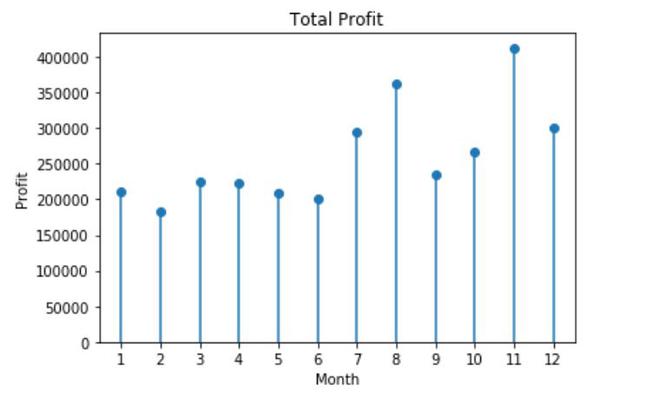
使用plt.stem函数,它会在图表下从基线到 y 的每个 x 位置创建垂直线,并在那里放置一个标记。但它不灵活,因此您可能还想尝试其他方法。
在本例中,我们将通过使用 pandas 从 CSV 文件中收集数据来绘制棒棒糖图表。
首先,我们将通过plt.subplots()创建一个空图表,并使用以 (x,y) 形式接受参数的茎图,两者都可以是类似数组的值,我们将这些值绘制到图表中。 use_line_collection=True提高了茎图的性能,并将茎线绘制为 LineCollection 而不是单独的线。 basefmt=' '从主干线中删除基线。
CSV 文件的列为“month_number”和“total_profit”,它们已从 CSV 文件中读取并作为 (x,y) 传递到茎图中,并且还添加了一些格式和详细信息。
set_ylim()设置为零,以便 y 轴值从零开始。
方法:
- 导入模块(matplotlib 和 pandas)
- 打开CSV文件并读取数据
- 使用 plt.stem 绘制它
Python3
# importing modules
from pandas import *
import matplotlib.pyplot as plt

# reading CSV file
d = read_csv("company_sales_data.csv")

# creating an empty chart
fig, axes = plt.subplots()

# plotting using plt.stem
axes.stem(d['month_number'], d['total_profit'],
          use_line_collection=True, basefmt=' ')

# starting value of y-axis
axes.set_ylim(0)

# details and formatting of chart
plt.title('Total Profit')
plt.xlabel('Month')
plt.ylabel('Profit')
plt.xticks(d['month_number'])
Python3
# import modules
from pandas import *
from matplotlib import pyplot as plt

# read csv file
d = read_csv("company_sales_data.csv")

# using subplots() to draw vertical lines
fig, axes = plt.subplots()
axes.vlines(d['month_number'], ymin=0, ymax=d['total_profit'])

# drawing the markers (circle)
axes.plot(d['month_number'], d['total_profit'], "o")
axes.set_ylim(0)

# formatting and details
plt.xlabel('Month')
plt.ylabel('Profit')
plt.title('Total Profit')
plt.xticks(d['month_number'])
Python3
# import modules
from pandas import *
from matplotlib import pyplot as plt

# read csv file
d = read_csv("company_sales_data.csv")

# using subplots() to draw vertical lines
fig, axes = plt.subplots()

# providing list of colors
line_colors = ['blue', 'cyan', 'green', 'red',
               'skyblue', 'brown', 'yellow',
               'black', 'grey', 'orange', 'maroon',
               'lightgreen']

axes.hlines(d['month_number'], xmin=0,
            xmax=d['total_profit'], colors=line_colors)

# drawing the markers (circle)
axes.plot(d['total_profit'], d['month_number'], "o")
axes.set_xlim(0)

# formatting and details
plt.xlabel('Profit')
plt.ylabel('Month')
plt.title('Total Profit')
plt.yticks(d['month_number'])
输出:

示例 2:
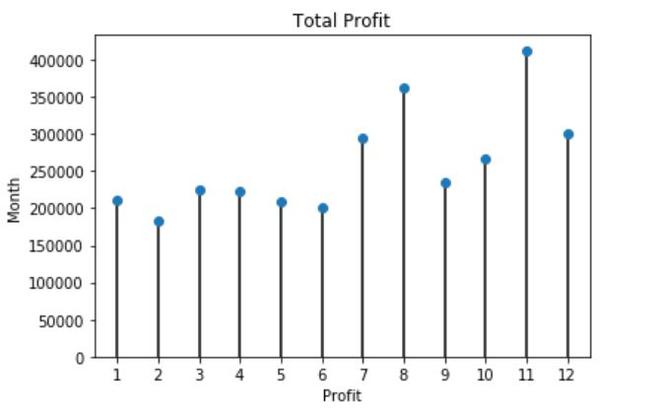
在这个例子中,我们将使用plt.subplots()创建一个空的图形/图表,然后在从 CSV 文件的列中读取数据后,我们将使用vlines()函数绘制垂直线,该函数将参数作为(x,ymin ,ymax)其中ymin是最小值, ymax是要绘制的最大值。
绘制垂直线后,我们将使用plot()函数绘制圆形标记,最终形成棒棒糖图表。
蟒蛇3
# import modules
from pandas import *
from matplotlib import pyplot as plt

# read csv file
d = read_csv("company_sales_data.csv")

# using subplots() to draw vertical lines
fig, axes = plt.subplots()
axes.vlines(d['month_number'], ymin=0, ymax=d['total_profit'])

# drawing the markers (circle)
axes.plot(d['month_number'], d['total_profit'], "o")
axes.set_ylim(0)

# formatting and details
plt.xlabel('Month')
plt.ylabel('Profit')
plt.title('Total Profit')
plt.xticks(d['month_number'])
输出:

示例 3:
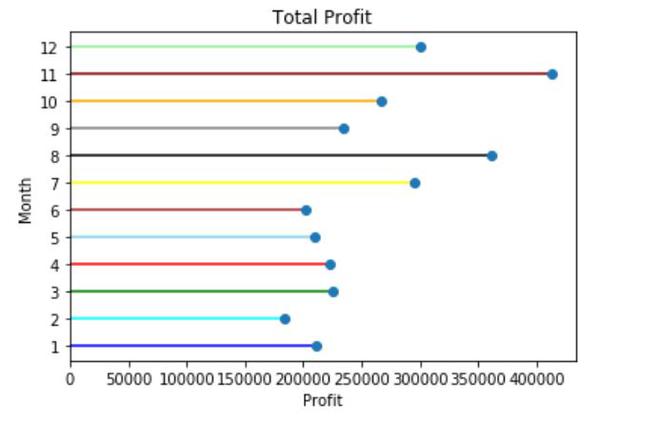
此示例与第二种方法相同,唯一的区别在于绘制线条,这里我们将水平绘制线条。因此,我们将使用plt.subplots()创建一个空的图形/图表,然后在从 CSV 文件的列中读取数据后,我们将使用hlines()函数绘制垂直线,该函数将参数作为 (y,xmin,xmax ) 其中xmin是最小值, xmax是要绘制的最大值。
再次绘制垂直线后,我们将使用plot()函数绘制圆形标记,最终形成棒棒糖图表。这里我们会为每个月添加不同的颜色,让它看起来更有吸引力,hlines()函数作为选项颜色来设置不同线条的颜色。
蟒蛇3
# import modules
from pandas import *
from matplotlib import pyplot as plt

# read csv file
d = read_csv("company_sales_data.csv")

# using subplots() to draw vertical lines
fig, axes = plt.subplots()

# providing list of colors
line_colors = ['blue', 'cyan', 'green', 'red',
               'skyblue', 'brown', 'yellow',
               'black', 'grey', 'orange', 'maroon',
               'lightgreen']

axes.hlines(d['month_number'], xmin=0,
            xmax=d['total_profit'], colors=line_colors)

# drawing the markers (circle)
axes.plot(d['total_profit'], d['month_number'], "o")
axes.set_xlim(0)

# formatting and details
plt.xlabel('Profit')
plt.ylabel('Month')
plt.title('Total Profit')
plt.yticks(d['month_number'])
输出:
