将面板边框添加到 R 中的 ggplot2 绘图
在本文中,我们将使用 theme()函数在 R 编程语言中为绘图添加面板边框。在这里,我们将创建一个散点图,但您可以将其应用于任何图并为其添加面板边框。
方法:
- 指定数据对象,它必须是一个数据框。这里它有两个变量名为 year 和 point。
- 调用 ggplot()函数。放置第一个参数“data”,然后设置美学函数“aes()”。
- 在 aes()函数,为 X 轴设置年份变量,为 Y 轴使用点变量。
- 调用 ggtitle() 来设置图的标题。
- 调用 geom_point()函数。在 geom_point()函数,我们使用带有 size 参数的 aes() 来设置点的大小,并使用 col 参数来设置点的颜色。
- 添加 Panel Border 以使用 theme()函数和 panel.border 作为其参数进行绘图。要将面板边框添加到 R 图中,我们只需将 theme()函数添加到 ggplot()函数。在 theme()函数,我们必须指定 panel.border 参数以在绘图周围添加面板边框,并使用 element_rect()函数作为 panel.border 参数的值。
Syntax: theme(panel.border)
Parameter: theme() has many parameters to specify the theme of plot. we can use them as per our requirements but for add panel border to plot, we will use only panel.border parameter and specify element_rect() function as it’s value.
Return: Theme of the plot.
element_rect() 用于指定边框和背景。
Syntax:
element_rect(color = “color_name”, fill = NULL, size = NULL, linetype = NULL)
Parameter:
- fill : Specifies the color by which we fill whole rectangle.
- color : For specifying border color.
- size : For specifying border size.
- linetype : For specifying border line type
Return: Border around plot.
使用中的数据集: year point 1 2011 10 2 2012 20 3 2013 30 4 2014 40 5 2015 50
让我们首先创建一个常规散点图以更好地理解差异。
例子:
R
# load ggplot2 package
library(ggplot2)

# Create a dataframe for Plot data
data <- data.frame(year = c(2011, 2012, 2013, 2014, 2015),
                   point = c(10, 20, 30, 40, 50))

# Plot the scatter plot
ggplot(data, aes(year, point)) +
  geom_point()+
  ggtitle("Scatter Plot")
R
# load ggplot2 package
library(ggplot2)

# Create a dataframe for Plot data
data <- data.frame(year = c(2011, 2012, 2013, 2014, 2015),
                   point = c(10, 20, 30, 40, 50))

# Plot the scatter plot with panel border
# of size 10 and green color
ggplot(data, aes(year, point)) +
  geom_point()+
  ggtitle("Scatter Plot with Panel Border")+
  theme(panel.border = element_rect(color = "green",
                                    fill = NA,
                                    size = 10))
输出:
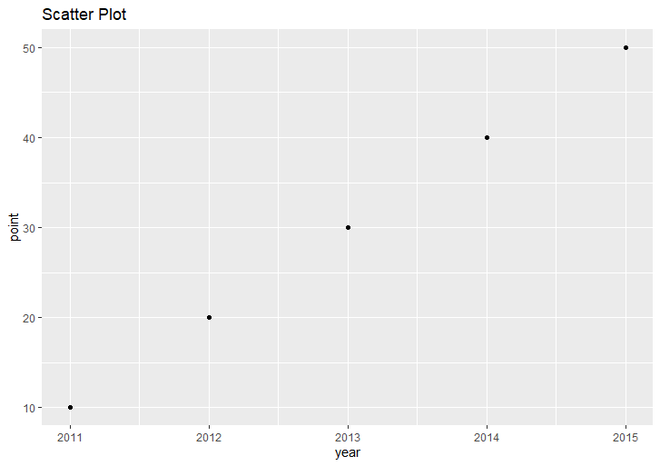
使用 ggplot2 的简单散点图
现在让我们给它添加一个边框并显示结果。
例子:
电阻
# load ggplot2 package
library(ggplot2)

# Create a dataframe for Plot data
data <- data.frame(year = c(2011, 2012, 2013, 2014, 2015),
                   point = c(10, 20, 30, 40, 50))

# Plot the scatter plot with panel border
# of size 10 and green color
ggplot(data, aes(year, point)) +
  geom_point()+
  ggtitle("Scatter Plot with Panel Border")+
  theme(panel.border = element_rect(color = "green",
                                    fill = NA,
                                    size = 10))
输出:
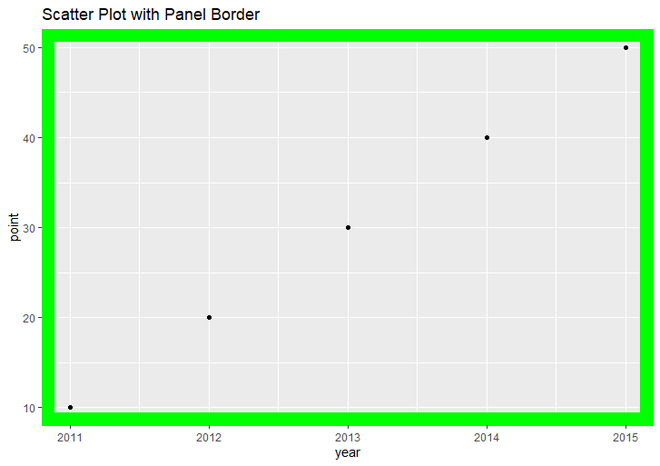
带面板边框的散点图