📌 相关文章
- barh matplotlib 的更改顺序 - Python (1)
- Python中的 Matplotlib.pyplot.barh()函数(1)
- Python中的 Matplotlib.pyplot.barh()函数
- MATLAB 2D fill()(1)
- MATLAB 2D fill()
- barh matplotlib 的更改顺序 - Python 代码示例
- MATLAB 2D area()
- MATLAB 2D Bar()
- MATLAB 2D Bar()(1)
- c++ 代码 2d 块 - C++ (1)
- MATLAB 2D Pie()(1)
- MATLAB 2D Pie()
- MATLAB 2D hist()
- MATLAB 2D hist()(1)
- plot.barh() group by (1)
- MATLAB 2D quiver()
- MATLAB 2D quiver()(1)
- MATLAB 2-D图(1)
- : 在 matlab (1)
- MATLAB 2-D图
- MATLAB中的饼图
- matlab 轴 - Matlab (1)
- MATLAB中的饼图(1)
- 根 matlab (1)
- MATLAB 2D stem()(1)
- MATLAB 2D stem()
- MATLAB 2D errorbar()
- MATLAB 2D errorbar()(1)
- MATLAB 2D Semilogx()(1)
📜 MATLAB 2D barh()
📅 最后修改于: 2021-01-07 02:37:52 🧑 作者: Mango
MATLAB barh()
此函数创建水平条形图,其中x中的值用于标记每个条,y中的值用于确定条的水平长度。
句法
barh(y) // It creates a horizontal bar graph with one bar for each element in y. If y is an m-by-n matrix, then barh creates m groups of n bars.
barh(x,y)// It draws the bars along the vertical axis at the locations specified by x.
例
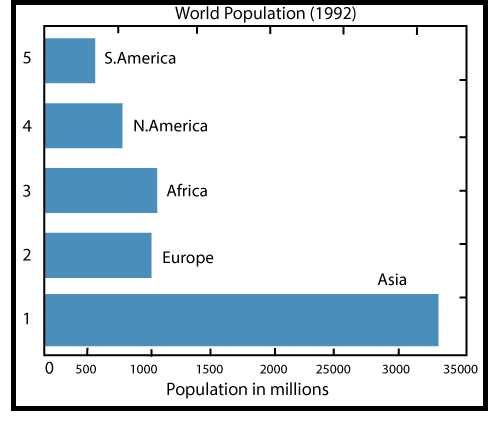
World population by continents
cont=char ('Asia','Europe','Africa',...'N.America','S.America');
pop=[333.2;696;694;437;307];
barh(pop)
for i=1:5,
    gtext(cont(i,:));
end
xlabel('Population in millions');
Title (World population (1992)','fontsize', 18)
输出:
