在 Matplotlib 中的直方图条之间添加空格
Matplotlib 是Python编程语言中的绘图库,默认情况下它是Python语言中 NumPy 库的数值数学扩展。在使用Python语言编程时,我们使用 matplotlib 库包进行图形和直方图可视化。但是在Python中使用 matplotlib 绘制直方图时,相邻条之间缺少分隔或空间。这使得直方图使用起来非常繁琐,并且变得非常难以解释。在本文中,我们将研究如何在 matplotlib 中在直方图条之间添加空间。
让我们通过这个例子来理解:
示例 1:创建一个简单的绘图。
Python3
import matplotlib.pyplot as plt

values = [1, 2, 3, 3, 4, 5, 6, 6, 7, 8]

# Adjust the bar widths here
plt.hist(values)

plt.ylabel("Quantity")
plt.xlabel("Value")
plt.show()
Python3
import matplotlib.pyplot as plt

values = [1, 2, 3, 3, 4, 5, 6, 6, 7, 8]

# Adjust the bar widths here
plt.hist(values, rwidth=0.7)

plt.ylabel("Quantity")
plt.xlabel("Value")
plt.show()
Python3
# Implementation of matplotlib function
import matplotlib
import numpy as np
import matplotlib.pyplot as plt

np.random.seed(10**7)
n_bins = 20
x = np.random.randn(10000, 3)

colors = ['green', 'blue', 'lime']

plt.hist(x, n_bins, density = True,
         histtype ='bar',
         color = colors,
         label = colors)

plt.legend(prop ={'size': 10})
plt.show()
Python3
# Implementation of matplotlib function
import matplotlib
import numpy as np
import matplotlib.pyplot as plt

np.random.seed(10**7)
n_bins = 20
x = np.random.randn(10000, 3)

colors = ['green', 'blue', 'lime']

plt.hist(x, n_bins, density = True,
         histtype ='bar',
         color = colors,
         label = colors,
         rwidth = 0.5)

plt.legend(prop ={'size': 10})

plt.title('matplotlib.pyplot.hist() function Example\n\n',
          fontweight ="bold")

plt.show()
输出:

现在我们将在直方图条之间添加空间:
可以通过在“plt.hist()”函数中使用rwidth参数来添加条形之间的空间。此值指定条形相对于其默认宽度的宽度, rwidth的值不能大于 1。
蟒蛇3
import matplotlib.pyplot as plt

values = [1, 2, 3, 3, 4, 5, 6, 6, 7, 8]

# Adjust the bar widths here
plt.hist(values, rwidth=0.7)

plt.ylabel("Quantity")
plt.xlabel("Value")
plt.show()
输出:

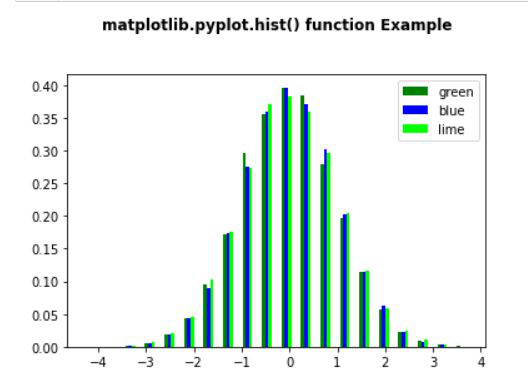
示例 2:创建一个简单的绘图。
蟒蛇3
# Implementation of matplotlib function
import matplotlib
import numpy as np
import matplotlib.pyplot as plt

np.random.seed(10**7)
n_bins = 20
x = np.random.randn(10000, 3)

colors = ['green', 'blue', 'lime']

plt.hist(x, n_bins, density = True,
         histtype ='bar',
         color = colors,
         label = colors)

plt.legend(prop ={'size': 10})
plt.show()
输出:

添加空间:
蟒蛇3
# Implementation of matplotlib function
import matplotlib
import numpy as np
import matplotlib.pyplot as plt

np.random.seed(10**7)
n_bins = 20
x = np.random.randn(10000, 3)

colors = ['green', 'blue', 'lime']

plt.hist(x, n_bins, density = True,
         histtype ='bar',
         color = colors,
         label = colors,
         rwidth = 0.5)

plt.legend(prop ={'size': 10})

plt.title('matplotlib.pyplot.hist() function Example\n\n',
          fontweight ="bold")

plt.show()
输出: