Matplotlib 中的网格
网格由相交的直线(垂直、水平和角度)或曲线组成,用于构建我们的内容。 Matplotlib 帮助我们绘制简单的图形,但有时需要使用网格来更好地理解并获取我们数据点的参考。因此,Matplotlib 提供了一个grid()来轻松创建具有大量自定义的网格线。
matplotlib.pyplot.grid()
Syntax: matplotlib.pyplot.grid(b=None, which=’major’, axis=’both’, **kwargs)
Parameters:
b: bool value to specify whether to show grid-lines. Default is True
which: The grid lines to apply changes. Values: {‘major’, ‘minor’, ‘both’}
axis: The axis to apply changes on. Values: {‘both’, ‘x’, ‘y’}
**kwargs: Optional line properties
Returns: This function doesn’t return anything.
grid()通过指定一个布尔值 (True/False) 来设置网格的可见性。我们还可以选择显示次要或主要刻度或两者。此外,颜色、线宽和线型可以作为附加参数进行更改。让我们看一些例子:
示例 #1:
# Implementation of matplotlib function
import matplotlib.pyplot as plt
import numpy as np

# dummy data
x1 = np.linspace(0.0, 5.0)
y1 = np.cos(2 * np.pi * x1) * np.exp(-x1)

# creates two subplots
fig, (ax1, ax2) = plt.subplots(1, 2, figsize = (12, 5))

# Plot without grid
ax1.plot(x1, y1)
ax1.set_title('Plot without grid')

# plot with grid
ax2.plot(x1, y1)
ax2.set_title("Plot with grid")

# draw gridlines
ax2.grid(True)

plt.show()
输出: 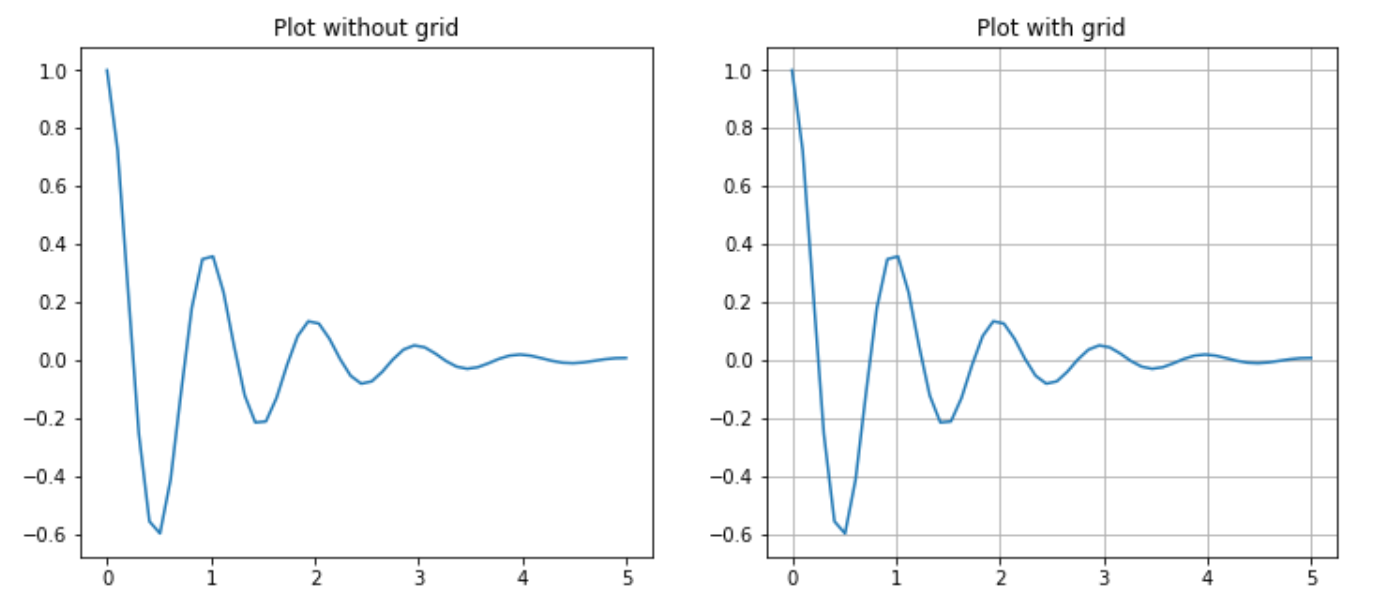
示例 #2:
现在让我们使用额外的线属性(例如颜色、线型和线宽)来绘制网格线。
# Implementation of matplotlib function
import matplotlib.pyplot as plt
import numpy as np

# dummy data
x = np.linspace(0, 2 * np.pi, 400)
y = np.sin(x ** 2)

# set graph color
plt.plot(x, y, 'green')

# to set title
plt.title("Plot with linewidth and linestyle")

# draws gridlines of grey color using given
# linewidth and linestyle
plt.grid(True, color = "grey", linewidth = "1.4", linestyle = "-.")

plt.show()
输出: 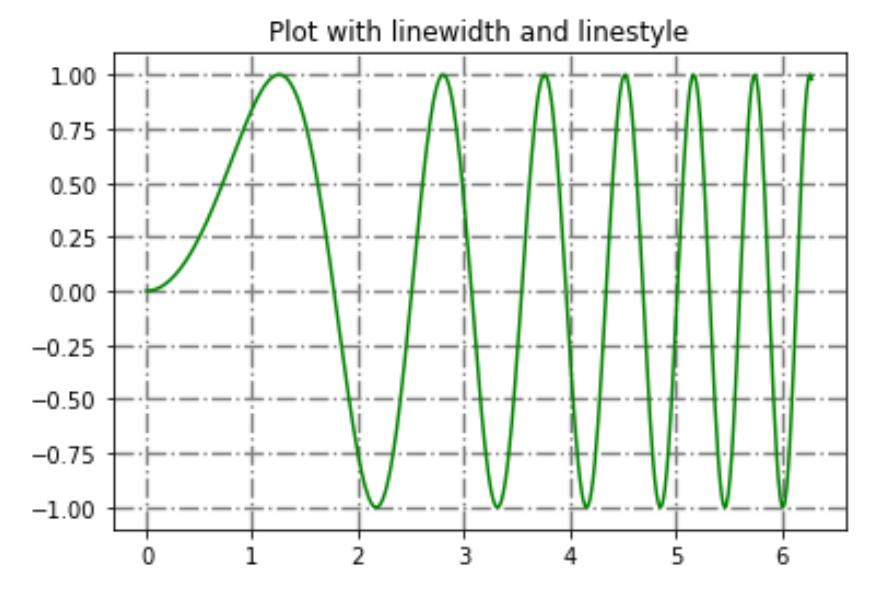
在评论中写代码?请使用 ide.geeksforgeeks.org,生成链接并在此处分享链接。