使用 Matplotlib 在Python中绘制四边形网格
Matplotlib是一个基于 NumPy 数组的多平台数据可视化库,旨在与更广泛的 SciPy 堆栈一起使用。 Matplotlib 也能够很好地与许多操作系统和图形后端配合使用。 matplotlib.pyplot也可用于类似 MATLAB 的绘图框架。
绘制四边形网格
使用 pyplot 模块的pcolormesh()函数,它类似于pcolor()函数,但 pcolor 返回PolyCollection而 pcolormesh 返回matplotlib.collections.QuadMesh 。 pcolormesh 更快,因此可以处理更大的数组。
Syntax : pcolormesh(cmap = [None | Colormap], alpha = [0<=scalar<=1 | None], edgecolors = [None | color | 'face'], shading = ['gouraud' | 'flat'], norm = [None | Normalize], vimax = [scalar | None], vimin = [scalar | None])
Parameters:
- cmap : It can be None or matplotlib has a number of built-in colormaps accessible via matplotlib.cm.get_cmap
- alpha : It can be None or alpha value between 0 to 1.
- edgecolors :
- If its None, edges will not be visible.
- ‘face’ represents the same color as faces.
- color sequence will set a color.
- shading : It can be either ‘flat’ or ‘gouraud’
- norm : If its None defaults to normalize().
- vimax : It can be either None or the scalar value.
- vimin : It can be either None or the scalar value. ( vimax and vimin are used in conjunction with normalize data)
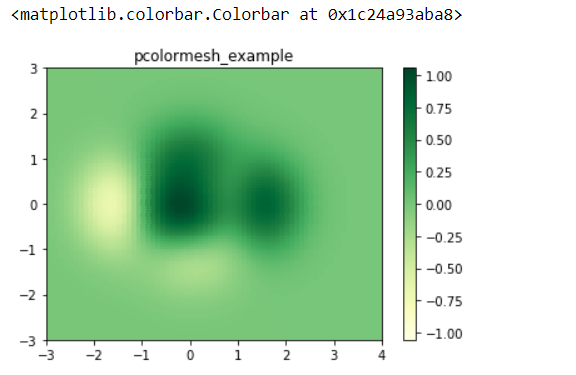
示例 1:
import matplotlib.pyplot as plt
import numpy as np


x1, y1 = 0.1, 0.05

# generate 2-D grids for the
# x & y bounds
y, x = np.mgrid[slice(-3, 3 + y1, y1), slice(-3, 4 + x1, x1)]
z = (1 - x / 2. + x ** 5 + y ** 3) * np.exp(-x ** 2 - y ** 2)

# Remove the last value from the
# z array as z must be inside x
# and y bounds.
z = z[:-1, :-1]
z_min, z_max = -np.abs(z).max(), np.abs(z).max()

plt.subplot()

plt.pcolormesh(x, y, z,
               cmap ='YlGn',
               vmin = z_min,
               vmax = z_max,
               edgecolors = 'face',
               shading ='flat')

plt.title('pcolormesh_example')

# set the limits of the plot
# to the limits of the data
plt.axis([x.min(), x.max(), y.min(), y.max()])

plt.colorbar()
plt.show()
输出 :

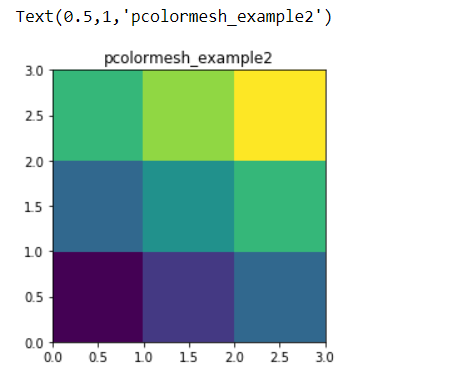
示例 2:
import matplotlib.pyplot as plt
import numpy as np


x = np.array([[0, 1, 2, 3],
              [0, 1, 2, 3],
              [0, 1, 2, 3],
              [0, 1, 2, 3]])

y = np.array([[0.0, 0.0, 0.0, 0],
              [1.0, 1.0, 1.0, 1],
              [2.0, 2.0, 2.0, 2],
              [3, 3, 3, 3]])

values = np.array([[0, 0.5, 1],
                   [1, 1.5, 2],
                   [2, 2.5, 3]])

fig, ax = plt.subplots()

ax.pcolormesh(x, y, values)
ax.set_aspect('equal')
ax.set_title("pcolormesh_example2")
输出 :
