MATLAB代表矩阵实验室。这是一种用于技术计算的高性能语言。它由MathWorks.Inc公司的Cleve Molar在1984年开发。用C,C++, Java编写。它允许矩阵处理,功能绘制,算法实现和用户界面创建。
MATLAB入门:
它既是一种编程语言,又是一种编程环境。它允许在命令窗口本身中计算语句。
- 命令窗口:
在此窗口中,必须键入并立即执行语句,因为它需要快速进行原型制作。这些语句无法保存。因此,它可用于小型,易于执行的程序。 - 编辑器(脚本):
在此窗口中,您可以执行带有多个语句的大型程序以及复杂的功能,这些功能可以保存并通过文件扩展名’.m’完成。 - 工作空间:
在此窗口中,将显示在程序过程中(在编辑器中)创建的变量的值。
该窗口显示正在创建的程序文件的确切位置(路径)。
MATLAB库随附了许多内置函数。这些函数主要执行正弦,余弦和切线之类的数学运算。它们还执行更复杂的功能,例如查找矩阵,叉积和点积的逆和行列式
尽管MATLAB是用C,C++和Java编码的,但比这三种语言更容易实现。例如,与其他三个文件不同,不需要在文件的开头初始化头文件,并且为了声明变量,不需要提供数据类型。它为向量运算提供了更简单的替代方法。可以使用一个命令而不是for或while循环中的多个语句来执行它们。
下面列出了MATLAB中的一些基本功能及其用法:
| Function | Description |
|---|---|
| disp() | The values or the text printed within single quotes is displayed on the output screen |
| clear | To clear all variables |
| close all | To close all graphics window |
| clc | To clear the command window |
| exp(x) | To compute the exponential value of x to the base e |
| abs(x) | To compute the absolute value of x |
| sqrt(x) | To compute the square root of x |
| log(x) | To compute the logarithmic value of x to the base e |
| log10(x) | To compute the logarithmic value of x to the base 10 |
| rem(x, y) | To compute the remainder of x/y |
| sin(x) | To compute the sine of x |
| cos(x) | To compute the cosine of x |
| tan(x) | To compute the tangent of x |
| atan2(x, y) | To compute the arctangent or inverse of y/x |
编写MATLAB程序:
- 使用命令窗口:
一次只能键入和执行一个语句。当按下回车键时,它将执行该语句。这主要用于简单的计算。注意: ans是MATLAB创建的默认变量,用于存储给定计算的输出。
- 使用编辑器:
可以在此处编写多行代码,并且只有在按下运行按钮(或F5)后才能执行代码。在程序开始时编写clc,清除并关闭所有命令始终是一个好习惯。注意:以分号结尾的语句将不会显示在命令窗口中,但是它们的值将显示在工作区中。
在MATLAB中任何后跟%的语句均被视为注释 - 向量运算:
加法,减法,乘法和除法等运算可以使用单个命令而不是多个循环来完成
我们还可以使用Colon(:)运算符提取单独的行和列。考虑大小为3X3的矩阵A。以下命令可用于从矩阵A提取行和列
| Command | Description |
|---|---|
| A(:, n) | To extract the elements of all rows in column n of the matrix |
| A(m, : ) | To extract the elements of all columns in row m of the matrix |
| A(:, m:n) | To extract the elements of all rows between columns m and n of the matrix |
| A(m:n, : ) | To extract the elements of all columns between rows m and n of the matrix |
| A(p:q, m:n) | To extract the elements of rows between p and q and columns between m and n of the matrix |
| A(m, n) | To extract the elements of row m and column n |
在MATLAB中绘图:
MATLAB图形系统由用于二维和三维数据可视化,图像处理,动画和演示图形的高级命令组成。它还包括低级命令,这些命令允许完全自定义图形的外观以及构建完整的图形用户界面。
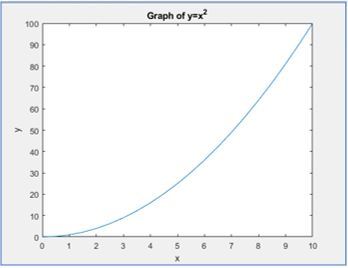
下面给出的是绘制抛物线的代码:
x = 0:0.5:10;%表示x从0到10以0.5的间隔变化
y = x>^2;%表示x中每个元素的平方存储在y中
plot(x, y)%plotting x and y
xlabel(X)%naming x axis as x
ylabel(Y)%naming y axis as y
title('Graph of y=x^2')%Title of the graph
该代码将给出以下图形:

您可以通过在plot命令中添加另一条语句来更改图形的颜色。例如,plot(x,y,’r’)将以红色显示图形线。
也可以绘制正弦图,余弦图和其他三角函数的曲线图。正弦曲线的代码如下:
x = 0:pi/100:2*pi;
y = sin(x);
plot(x,y,’g’)%将以绿色给出图形线。
总之,MATLAB是一种非常用户友好的语言,也很容易理解。它的库配备了可以帮助我们执行各种数学功能的函数。