在图像处理领域,理想高通滤波器(IHPF)用于频域中的图像锐化。图像锐化是一种增强精细细节并突出显示数字图像边缘的技术。它从图像中去除了低频成分,并保留了高频成分。
理想的高通滤波器是理想的低通滤波器的反向操作。可以使用以下关系确定: ![]()
在哪里, ![]() 是高通滤波器的传递函数,
是高通滤波器的传递函数, ![]() 是相应的低通滤波器的传递函数。
是相应的低通滤波器的传递函数。
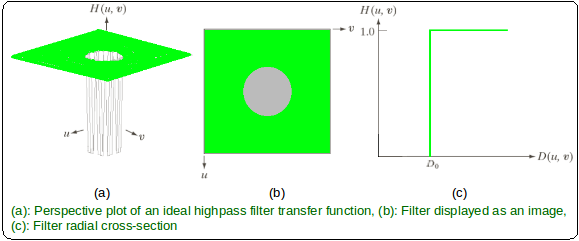
IHPF的传递函数可以通过以下函数指定: 
在哪里,
-
 是一个正常数。 IHPF将所有频率传递到半径圆之外
 从原点开始没有衰减,并切断了圆内的所有频率。
 - 这
 是H(u,v)= 1和H(u,v)= 0之间的过渡点,因此称为截止频率。
 -
 是从任意点(u,v)到频率平面原点的欧几里得距离,即
Approach:
Step 1: Input – Read an image
Step 2: Saving the size of the input image in pixels
Step 3: Get the Fourier Transform of the input_image
Step 4: Assign the Cut-off Frequency ![]()
Step 5: Designing filter: Ideal High Pass Filter
Step 6: Convolution between the Fourier Transformed input image and the filtering mask
Step 7: Take Inverse Fourier Transform of the convoluted image
Step 8: Display the resultant image as output
在MATLAB中的实现:
% MATLAB Code | Ideal High Pass Filter

% Reading input image : input_image
input_image = imread('[name of input image file].[file format]');

% Saving the size of the input_image in pixels-
% M : no of rows (height of the image)
% N : no of columns (width of the image)
[M, N] = size(input_image);

% Getting Fourier Transform of the input_image
% using MATLAB library function fft2 (2D fast fourier transform)
FT_img = fft2(double(input_image));

% Assign Cut-off Frequency
D0 = 10; % one can change this value accordingly

% Designing filter
u = 0:(M-1);
idx = find(u>M/2);
u(idx) = u(idx)-M;
v = 0:(N-1);
idy = find(v>N/2);
v(idy) = v(idy)-N;

% MATLAB library function meshgrid(v, u) returns 2D grid
%  which contains the coordinates of vectors v and u.
% Matrix V with each row is a copy of v, and matrix U
% with each column is a copy of u
[V, U] = meshgrid(v, u);

% Calculating Euclidean Distance
D = sqrt(U.^2+V.^2);

% Comparing with the cut-off frequency and
% determining the filtering mask
H = double(D > D0);

% Convolution between the Fourier Transformed image and the mask
G = H.*FT_img;

% Getting the resultant image by Inverse Fourier Transform
% of the convoluted image using MATLAB library function
% ifft2 (2D inverse fast fourier transform)
output_image = real(ifft2(double(G)));

% Displaying Input Image and Output Image
subplot(2, 1, 1), imshow(input_image),
subplot(2, 1, 2), imshow(output_image, [ ]);
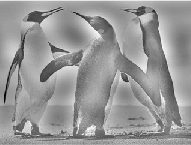
输入图像– 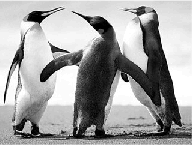
输出: