图像直方图是索引图像或灰度图像中强度分布的图表表示。它显示图像中每个强度值出现多少次。
代码1:使用MATLAB库函数显示图像的直方图。
% Read an Image in MATLAB Environment
img=imread('apple.jpg');

% Convert image to grayscale image
# if read image is an RGB image
img=rgb2gray(img);

% Show histogram of image
# using imhist() function
imhist(img);
代码2:不使用MATLAB Library函数显示图像的直方图。
方法 :
- 将源图像文件读入图像矩阵
- 如果它是RGB图像,则将其转换为灰度
- 遍历图像矩阵并计算每个可能的强度值的频率
- 绘制计数的频率
% Read source image file
img = imread('apple.jpg');
% Convert image to grayscale image
img=rgb2gray(img);
% get the dimension of the image
[x, y] = size(img);
% Create a frequency array of size 256
frequency = 1 : 256;
count = 0;
% Iterate over grayscale image matrix
% for every possible intensity value
% and count them
for i = 1 : 256
for j = 1 : x
for k = 1 : y
% if image pixel value at location (j, k) is i-1
% then increment count
if img(j, k) == i-1
count = count + 1;
end
end
end
% update ith position of frequency array with count
frequency(i) = count;
% reset count
count = 0;
end
n = 0 : 255;
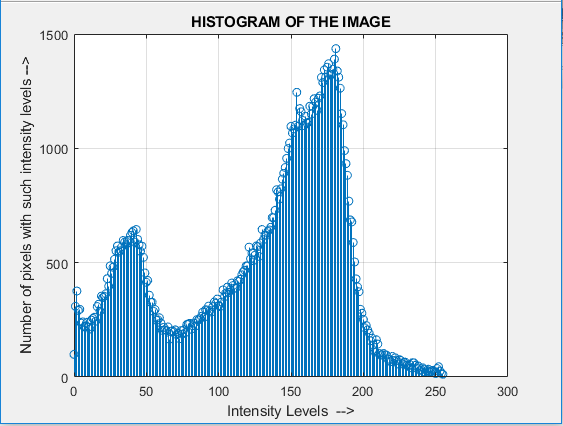
% Display Histogram
stem(n, frequency);
grid on;
ylabel('Number of pixels with such intensity levels -->');
xlabel('Intensity Levels -->');
title('HISTOGRAM OF THE IMAGE');
输入: 
输出: