Matplotlib - 文本框小部件
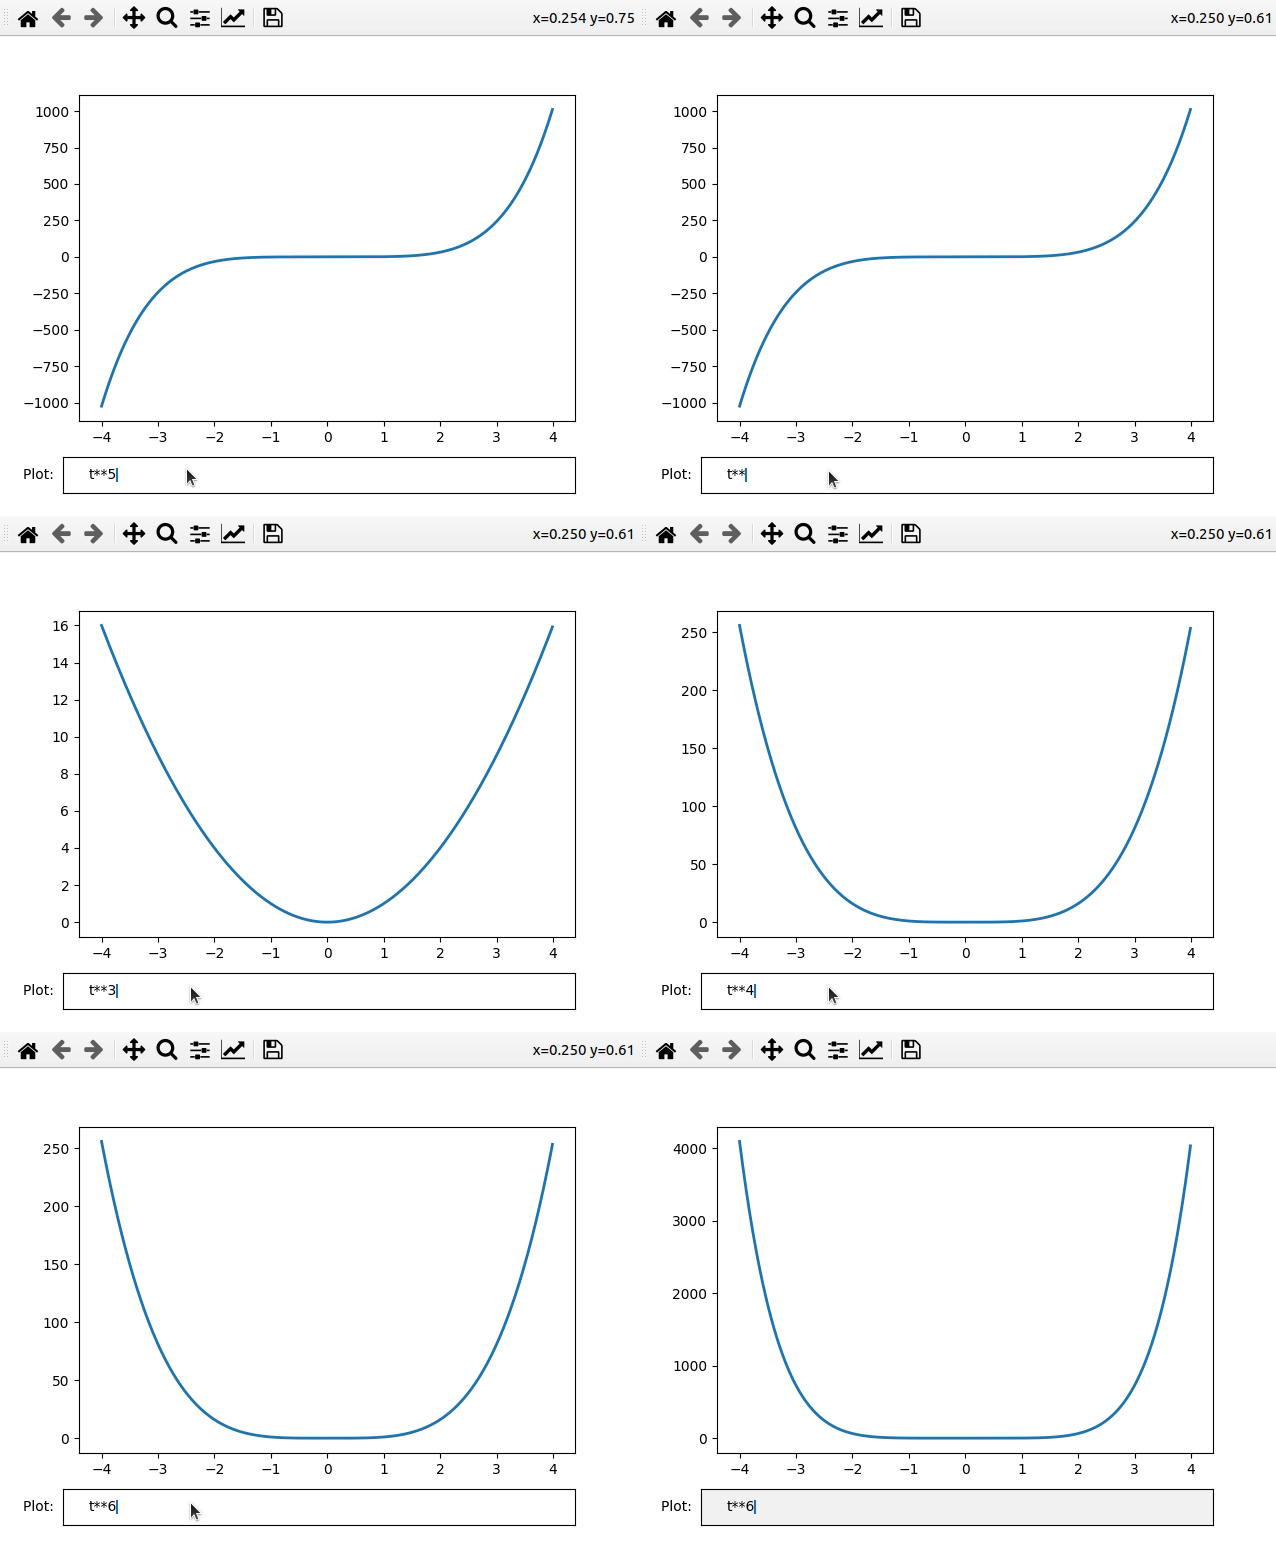
在本文中,我们将看到 matplotlib 的文本框小部件。 Matplotlib 是Python编程语言的绘图库。在本文中,我们将尝试使用文本框小部件绘制不同幂(例如 t^2、t^3、t^9 等)的图形。
文本框是一个接受用户输入的小部件。输入也可以是公式,以便我们可以根据这些公式生成图形。要使用这个小部件,我们使用TextBox()函数。
它接受两个参数
- 图即要使用的图形。
- 与文本框一起显示的文本,即标签到 txtBox。
下面是这个小部件的实现:
Python
# Import modules
import numpy as np
import matplotlib.pyplot as plt
from matplotlib.widgets import TextBox

# Adjust illustration
fig, ax = plt.subplots()
fig.subplots_adjust(bottom=0.2)

t = np.arange(-4.0, 4.0, 0.01)
l, = ax.plot(t, np.zeros_like(t), lw=2)

# Function to plot graph
# according to expression
def visualizeGraph(expr):
    ydata = eval(expr)
    l.set_ydata(ydata)
    ax.relim()
    ax.autoscale_view()
    plt.draw()

# Adding TextBox to graph
graphBox = fig.add_axes([0.1, 0.05, 0.8, 0.075])
txtBox = TextBox(graphBox, "Plot: ")
txtBox.on_submit(visualizeGraph)
txtBox.set_val("t**5")

# Plot graph
plt.show()
输出:

解释:
在上面的程序中,我们为 t 2创建了一个图作为默认图。在标记为Plot: 的txtBox 中,我们可以输入要查看图表的公式。