Matplotlib - 按钮小部件
在 Matplotlib 中,按钮是我们可以执行各种操作的重要小部件之一。它们主要用于制作具有不同属性的良好功能图。共有三种类型的按钮
- 按钮
- 单选按钮
- 检查按钮
在本文中,我们将学习如何在 matplotlib 图中使用不同的按钮。为此,我们将使用一些数据,绘制图形,然后形成一个按钮并使用它。借助一些例子,让我们一一了解按钮。
简单按钮
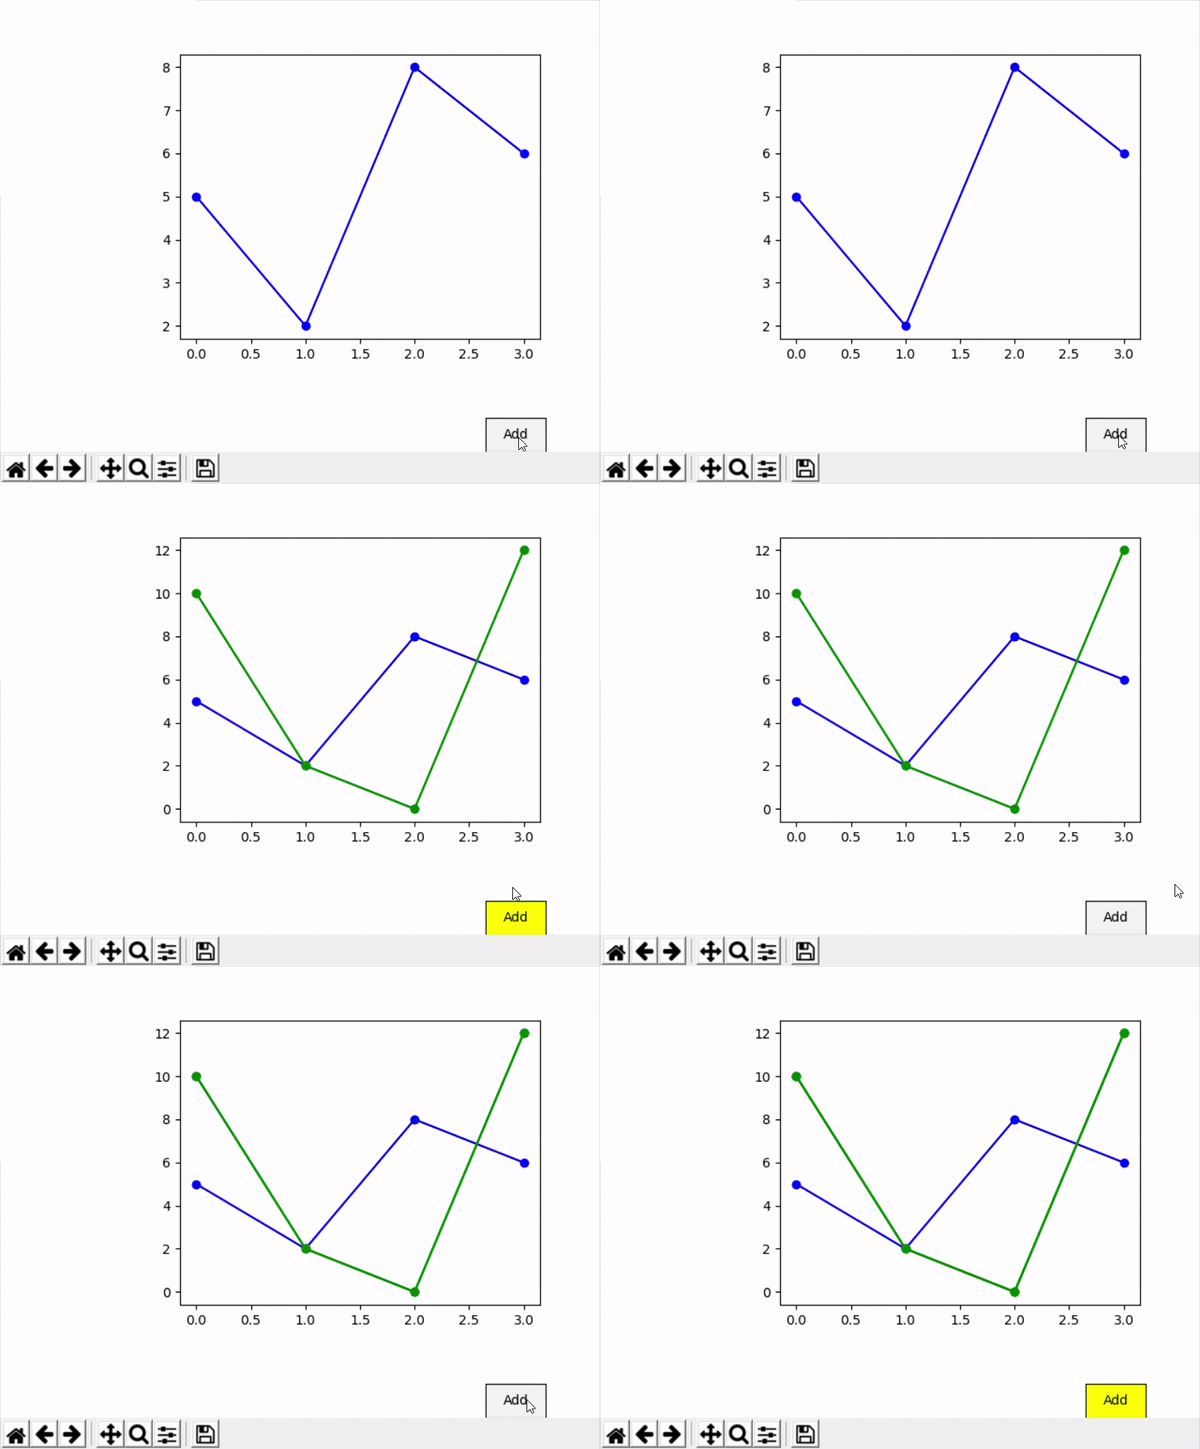
这是一个简单的按钮,只负责执行一项函数。
Syntax: simple_button=Button()
Parameters:
- ax– defines the axes where the button should be located
- label– the name that we want on the button
- color– color of the button
- hover color– color of the button when it gets clicked
在本例中,我们将创建一个简单的按钮,我们将使用此按钮向现有图形中再添加一条线。
Python3
# importing libraries
import numpy as np
import matplotlib.pyplot as plt
from matplotlib.widgets import Button


# creating data
x1=np.array([0,1,2,3])
y1=np.array([5,2,8,6])

# creating plot
fig = plt.figure()
ax = fig.subplots()
plt.subplots_adjust(left = 0.3, bottom = 0.25)
p,=ax.plot(x1,y1,color="blue", marker="o")


# defining function to add line plot
def add(val):
  x2=np.array([0,1,2,3])
  y2=np.array([10,2,0,12])
  ax.plot(x2,y2,color="green", marker="o")


# defining button and add its functionality
axes = plt.axes([0.81, 0.000001, 0.1, 0.075])
bnext = Button(axes, 'Add',color="yellow")
bnext.on_clicked(add)
plt.show()
Python3
import numpy as np
import matplotlib.pyplot as plt
from matplotlib.widgets import RadioButtons


# creating an array starting from
# 0 to 1 with step size 0.01
t = np.arange(0.0, 1.0, 0.01)

# the values of sin values of t
s0 = np.sin(2*np.pi*t)

# depict visualization
fig, ax = plt.subplots()
l, = ax.plot(t, s0, lw=2, color='red')
plt.subplots_adjust(left=0.3)

# adjust radio buttons
axcolor = 'lightgoldenrodyellow'
rax = plt.axes([0.05, 0.4, 0.15, 0.30],
               facecolor=axcolor)

radio = RadioButtons(rax, ['red', 'blue', 'green'],
                     [True,False,False,False],
                     activecolor='r')

def color(labels):
    l.set_color(labels)
    fig.canvas.draw()
radio.on_clicked(color)

plt.show()
Python3
import numpy as np
import matplotlib.pyplot as plt
from matplotlib.widgets import Button, RadioButtons, CheckButtons


fig = plt.figure()
ax = fig.subplots()
plt.subplots_adjust(left=0.3, bottom=0.25)

x1 = np.array([0, 1, 2, 3])
y1 = np.array([5, 2, 8, 6])
p, = ax.plot(x1, y1, color="blue", marker="o")

x2 = np.array([0, 1, 2, 3])
y2 = np.array([10, 2, 0, 12])
p1, = ax.plot(x2, y2, color="green", marker="o")

x3 = np.array([0, 1, 2, 3])
y3 = np.array([0, 3, 2, 19])
p2, = ax.plot(x3, y3, color="yellow", marker="o")
lines = [p, p1, p2]
labels = ["plot1", "plot2", "plot3"]


def func(label):
    index = labels.index(label)
    lines[index].set_visible(not lines[index].get_visible())
    fig.canvas.draw()


label = [True, True, True]

# xposition, yposition, width and height
ax_check = plt.axes([0.9, 0.001, 0.2, 0.3])
plot_button = CheckButtons(ax_check, labels, label)
plot_button.on_clicked(func)

plt.show()
输出:

单选按钮
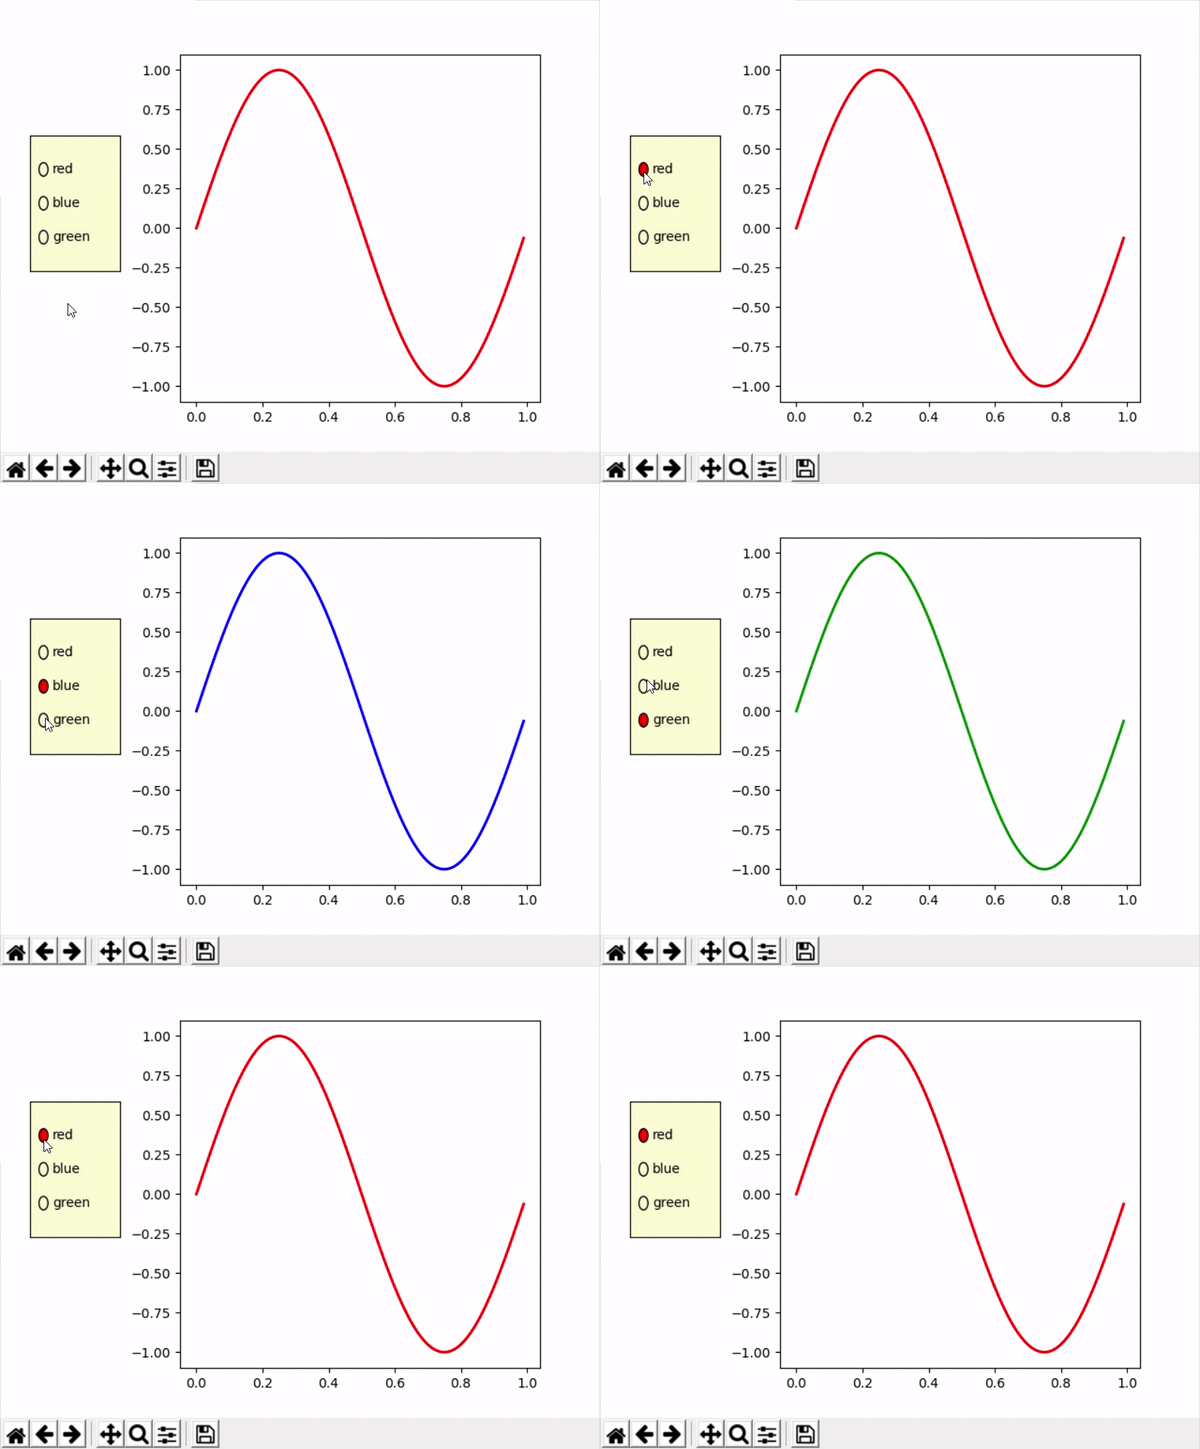
这种类型的按钮由一系列圆形按钮组成,可用于启用/禁用我们图形的一项功能。
Syntax: radio_button=RadioButtons()
Parameters:
- ax– defines the axes where the button should be located
- label– list of names that we want on every button
- active– list of booleans describing the state of each button
- active color– color of the active button
在这里,我们创建了一个简单的 sin 图,其中单选按钮显示图中线条的颜色。
蟒蛇3
import numpy as np
import matplotlib.pyplot as plt
from matplotlib.widgets import RadioButtons


# creating an array starting from
# 0 to 1 with step size 0.01
t = np.arange(0.0, 1.0, 0.01)

# the values of sin values of t
s0 = np.sin(2*np.pi*t)

# depict visualization
fig, ax = plt.subplots()
l, = ax.plot(t, s0, lw=2, color='red')
plt.subplots_adjust(left=0.3)

# adjust radio buttons
axcolor = 'lightgoldenrodyellow'
rax = plt.axes([0.05, 0.4, 0.15, 0.30],
               facecolor=axcolor)

radio = RadioButtons(rax, ['red', 'blue', 'green'],
                     [True,False,False,False],
                     activecolor='r')

def color(labels):
    l.set_color(labels)
    fig.canvas.draw()
radio.on_clicked(color)

plt.show()
输出:

检查按钮
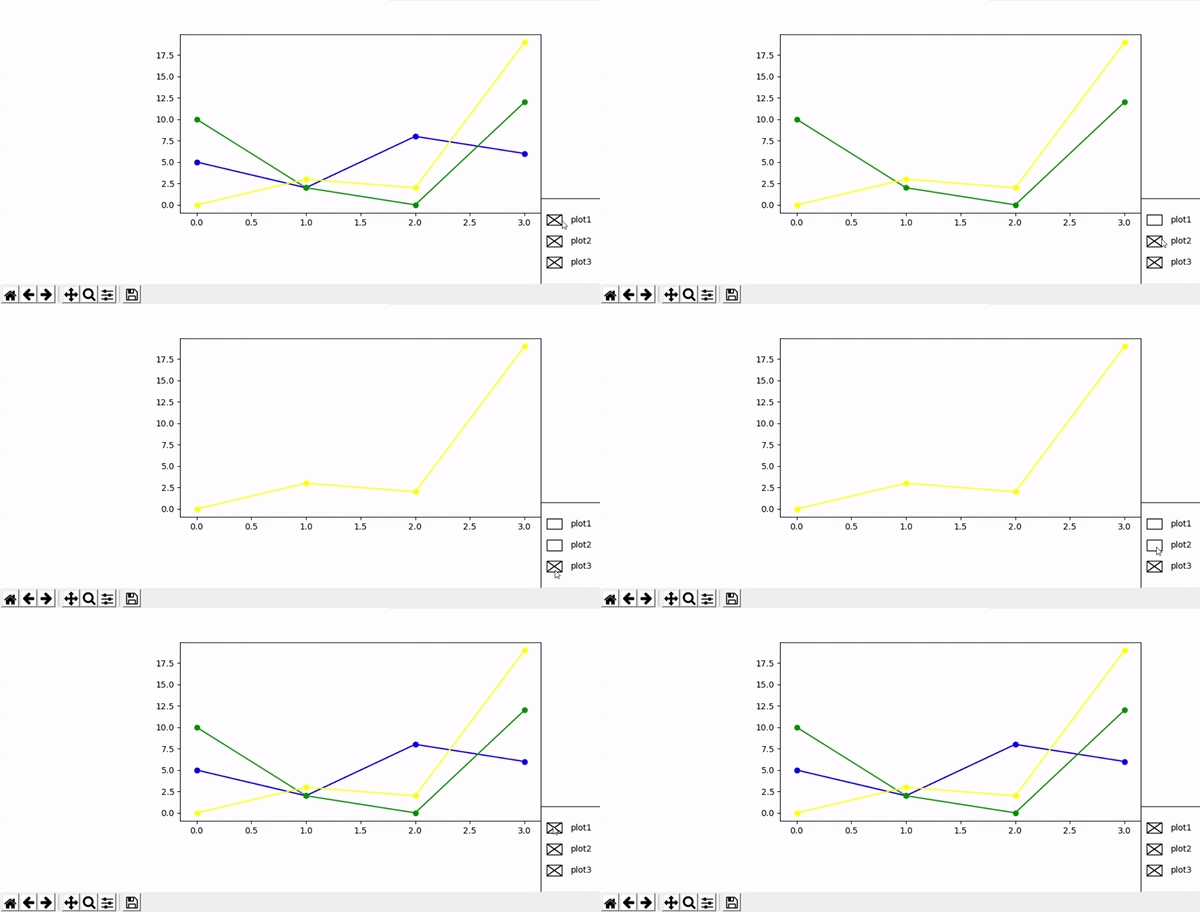
与我们只能选择一个选项的 Radio Button 不同,Check Button 允许我们选择多个选项。当我们想在绘图上执行 2 个或更多功能时,此功能很有用。
Syntax: check_button=CheckButtons()
Parameters:
- ax– defines the axes where the button should be located
- label– list of names that we want on every button
- actives– list of booleans describing the state of each button
我们创建了与简单按钮相同的图,但为复选按钮添加了另外 2 个图形。我们同时绘制了它。
蟒蛇3
import numpy as np
import matplotlib.pyplot as plt
from matplotlib.widgets import Button, RadioButtons, CheckButtons


fig = plt.figure()
ax = fig.subplots()
plt.subplots_adjust(left=0.3, bottom=0.25)

x1 = np.array([0, 1, 2, 3])
y1 = np.array([5, 2, 8, 6])
p, = ax.plot(x1, y1, color="blue", marker="o")

x2 = np.array([0, 1, 2, 3])
y2 = np.array([10, 2, 0, 12])
p1, = ax.plot(x2, y2, color="green", marker="o")

x3 = np.array([0, 1, 2, 3])
y3 = np.array([0, 3, 2, 19])
p2, = ax.plot(x3, y3, color="yellow", marker="o")
lines = [p, p1, p2]
labels = ["plot1", "plot2", "plot3"]


def func(label):
    index = labels.index(label)
    lines[index].set_visible(not lines[index].get_visible())
    fig.canvas.draw()


label = [True, True, True]

# xposition, yposition, width and height
ax_check = plt.axes([0.9, 0.001, 0.2, 0.3])
plot_button = CheckButtons(ax_check, labels, label)
plot_button.on_clicked(func)

plt.show()
输出:
