Matplotlib - 滑块小部件
Matplotlib 提供了几个小部件来制作交互式绘图。在这些小部件中,此处讨论了 Slider 小部件。滑块提供对绘图的视觉属性的控制。 Slider()用于在提供的轴上放置一个表示浮点范围的滑块。
Syntax:
class matplotlib.widgets.Slider(ax, label, valmin, valmax, valinit=0.5, valfmt=None, closedmin=True, closedmax=True, slidermin=None, slidermax=None, dragging=True, valstep=None, orientation=’horizontal’, **kwargs)
Parameters:
- ax: A matplotlib.axes.Axes instance where a slider is placed
- label: Slider text label
- valmin: The minimum value of the slider
- valmax: The maximum value of the slider
- valinit: Initial Value of a slider. Default value is 0.5.
- valfmt: Slider value format string (%-format). Default value is None. If None, a ScalarFormatter is used.
- closedmin: Slider interval is closed on bottom or not.
- closedmax: Slider interval is closed on the top or not.
- slidermin: Forbid current slider to have value less than current value of the given slider. Default value is None.
- slidermax: Forbid current slider to have value greater than current value of the given slider. Default value is None.
- dragging: The slider can be dragged by mouse or not. Default value is True (slider can be dragged by mouse)
- valstep: The slider will slides at values in multiples of valstep value. Default value is None.
- orientation: The slider orientation, vertical or horizontal . Default value is horizontal.
- kwargs are related to Rectangle that draws the slider knob. Valid properties such as facecolor, edgecolor, alpha, etc. of Matplotlib.patches.Rectangle can be used here.
方法:
- disconnect(self, cid):移除连接id为cid的观察者
- on_changed(self, func):连接到滑块事件。当滑块值改变时,相应的函数func被调用。 Func将一个新的滑块值作为参数并返回连接 ID。
- reset(self):滑块值设置为初始值
- set_val(self, val):将滑块值设置为val
示例 1:
以下示例使用 reg、绿色、蓝色值滑块演示了条形图颜色的变化。
Python3
# Import libraries
import numpy as np
import matplotlib.pyplot as plt
from matplotlib.widgets import Slider, Button

# Create a subplot
fig, ax = plt.subplots()
plt.subplots_adjust(bottom=0.35)
r = 0.6
g = 0.2
b = 0.5

# Create and plot a bar chart
year = ['2002', '2004', '2006', '2008', '2010']
production = [25, 15, 35, 30, 10]
plt.bar(year, production, color=(r, g, b),
        edgecolor="black")

# Create 3 axes for 3 sliders red,green and blue
axred = plt.axes([0.25, 0.2, 0.65, 0.03])
axgreen = plt.axes([0.25, 0.15, 0.65, 0.03])
axblue = plt.axes([0.25, 0.1, 0.65, 0.03])

# Create a slider from 0.0 to 1.0 in axes axred
# with 0.6 as initial value.
red = Slider(axred, 'Red', 0.0, 1.0, 0.6)

# Create a slider from 0.0 to 1.0 in axes axgreen
# with 0.2 as initial value.
green = Slider(axgreen, 'Green', 0.0, 1.0, 0.2)

# Create a slider from 0.0 to 1.0 in axes axblue
# with 0.5(default) as initial value
blue = Slider(axblue, 'Blue', 0.0, 1.0)

# Create fuction to be called when slider value is changed

def update(val):
    r = red.val
    g = green.val
    b = blue.val
    ax.bar(year, production, color=(r, g, b),
           edgecolor="black")

# Call update function when slider value is changed
red.on_changed(update)
green.on_changed(update)
blue.on_changed(update)

# Create axes for reset button and create button
resetax = plt.axes([0.8, 0.025, 0.1, 0.04])
button = Button(resetax, 'Reset', color='gold',
                hovercolor='skyblue')

# Create a function resetSlider to set slider to
# initial values when Reset button is clicked

def resetSlider(event):
    red.reset()
    green.reset()
    blue.reset()

# Call resetSlider function when clicked on reset button
button.on_clicked(resetSlider)

# Display graph
plt.show()
Python3
# Import libraries
import numpy as np
import matplotlib.pyplot as plt
from matplotlib.widgets import Slider, Button

# Create subplot
fig, ax = plt.subplots()
plt.subplots_adjust(bottom=0.35)

# Create and plot sine wave
t = np.arange(0.0, 1.0, 0.001)
s = 5 * np.sin(2 * np.pi * 3 * t)
l, = plt.plot(t, s)

# Create axes for frequency and amplitude sliders
axfreq = plt.axes([0.25, 0.15, 0.65, 0.03])
axamplitude = plt.axes([0.25, 0.1, 0.65, 0.03])

# Create a slider from 0.0 to 20.0 in axes axfreq
# with 3 as initial value
freq = Slider(axfreq, 'Frequency', 0.0, 20.0, 3)

# Create a slider from 0.0 to 10.0 in axes axfreq
# with 5 as initial value and valsteps of 1.0
amplitude = Slider(axamplitude, 'Amplitude', 0.0,
                   10.0, 5, valstep=1.0)

# Create fuction to be called when slider value is changed

def update(val):
    f = freq.val
    a = amplitude.val
    l.set_ydata(a*np.sin(2*np.pi*f*t))

# Call update function when slider value is changed
freq.on_changed(update)
amplitude.on_changed(update)

# display graph
plt.show()
输出:

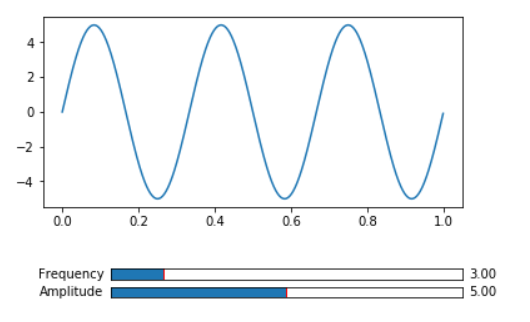
示例 2:
在此示例中,滑块用于更改正弦波的频率和幅度
蟒蛇3
# Import libraries
import numpy as np
import matplotlib.pyplot as plt
from matplotlib.widgets import Slider, Button

# Create subplot
fig, ax = plt.subplots()
plt.subplots_adjust(bottom=0.35)

# Create and plot sine wave
t = np.arange(0.0, 1.0, 0.001)
s = 5 * np.sin(2 * np.pi * 3 * t)
l, = plt.plot(t, s)

# Create axes for frequency and amplitude sliders
axfreq = plt.axes([0.25, 0.15, 0.65, 0.03])
axamplitude = plt.axes([0.25, 0.1, 0.65, 0.03])

# Create a slider from 0.0 to 20.0 in axes axfreq
# with 3 as initial value
freq = Slider(axfreq, 'Frequency', 0.0, 20.0, 3)

# Create a slider from 0.0 to 10.0 in axes axfreq
# with 5 as initial value and valsteps of 1.0
amplitude = Slider(axamplitude, 'Amplitude', 0.0,
                   10.0, 5, valstep=1.0)

# Create fuction to be called when slider value is changed

def update(val):
    f = freq.val
    a = amplitude.val
    l.set_ydata(a*np.sin(2*np.pi*f*t))

# Call update function when slider value is changed
freq.on_changed(update)
amplitude.on_changed(update)

# display graph
plt.show()
输出: