在 R 中重新排序箱线图
在本文中,我们将讨论如何在 R 编程语言中重新排列箱线图。
使用因子函数手动重新排序箱线图
在这种重新排序箱线图的方法下,用户需要调用 R 编程语言的内置函数factor函数,然后用户需要根据用户的要求将箱线图的新顺序传递到向量中作为其参数,此过程将导致箱线图的重新排序,如用户在 R 编程语言中配置的那样。
示例 1:
在这个例子中,我们将简单地创建 6 个不同单元的箱线图,每个单元带有 600 个随机数据点,借助箱线图函数和因子函数,我们将在 R 编程语言中重新排序单元
没有任何修改的初始箱线图:
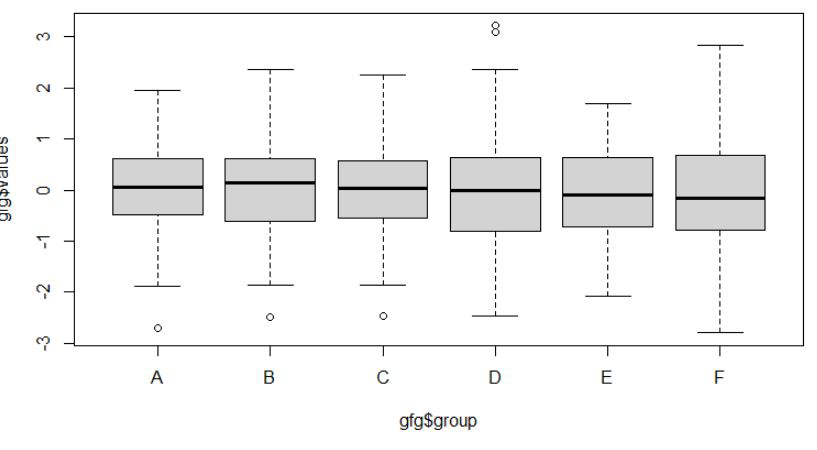
R
# create a dataframe with letters and value
gfg < - data.frame(group=rep(c('A', 'B', 'C', 'D', 'E', 'F')),
                   values=rnorm(600))

# factor the data
gfg$group < - factor(gfg$group, c("F", "C", "B", "E", "D", "A"))

# plot the data
boxplot(gfg$values ~ gfg$group)
R
# load the library
library("ggplot2")

# get the data
gfg < - data.frame(group=rep(c('A', 'B', 'C', 'D', 'E',
                               'F', 'G', 'H')), values=rnorm(800))
gfg$group < - factor(gfg$group, c("G", "F", "C", "B", "H", "E", "D", "A"))

# plot the data
ggplot(gfg, aes(group, values)) + geom_boxplot()
输出:

示例 2:
在这个例子中,我们将简单地创建 8 个不同单元的箱线图,每个单元在 ggplot2 中携带 800 个随机数据点,并使用因子函数,我们将在 R 编程语言中重新排序单元
没有任何修改的初始箱线图:

例子:
R
# load the library
library("ggplot2")

# get the data
gfg < - data.frame(group=rep(c('A', 'B', 'C', 'D', 'E',
                               'F', 'G', 'H')), values=rnorm(800))
gfg$group < - factor(gfg$group, c("G", "F", "C", "B", "H", "E", "D", "A"))

# plot the data
ggplot(gfg, aes(group, values)) + geom_boxplot()
输出:
