在 R 中 ggplot 的绘图区域内添加表格
在本文中,我们将看到如何使用 R 编程语言中的 ggplot2 库在绘图区域中添加数据框表。
使用中的数据集:

这里我们绘制散点图,对任何其他图也可以这样做。要在 ggplot2 中绘制散点图,我们使用函数geom_point()。
Syntax:
geom_point(mapping=NULL, data=NULL, stat=”identity”, position=”identity”,…)
Parameter:
- size : To assign size to the points.
- shape : To assign the shape, ggplot2 library has various shapes which are assigned with a numeric value ranging in [0,25].
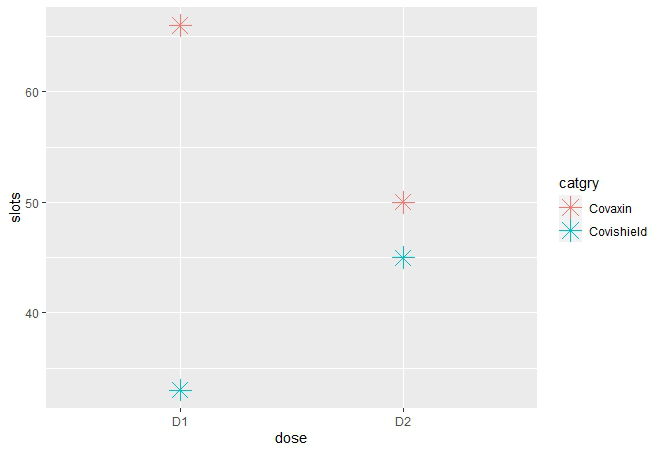
让我们先画一个没有表格的正则图,这样区别就很明显了。
例子:
R
library(ggplot2)

# Inserting data
vacc <- data.frame(catgry=rep(c("Covishield", "Covaxin"), each=2),
                   dose=rep(c("D1", "D2"),2),
                   slots=c(33, 45, 66, 50))

# To create ggplot2 scatter plot
plt <- ggplot(vacc, aes(dose, slots, color = catgry))+
  geom_point(shape=8,size = 5)

plt
R
library(ggplot2)
library(ggpmisc)

# Inserting data
vacc <- data.frame(catgry=rep(c("Covishield", "Covaxin"), each=2),
                   dose=rep(c("D1", "D2"),2),
                   slots=c(33, 45, 66, 50))
head(vacc)

# To create ggplot2 scatter plot
ggplot(vacc, aes(dose, slots, color = catgry))+
geom_point(shape=8,size = 5)+ annotate(geom = "table",x = 4,y = 12,
                                       label = list(cbind(vacc)))
输出:
为了首先向图中添加表格,我们使用cbind()创建表格。现在我们使用函数annotate()来注释表格。它用于指定表格在 ggplot 中的位置。
Syntax:
annotate(geom,x,y,xmin,xmax,ymin,ymax,label,vjust,hjust,….)
Parameters :
- geom : The name of the geom which is table here for which annotation has to be done
- x,y,xmax,ymax,xmin,ymin : Any two of these has to be mentioned in order to set the location of table in plot.
- label : Label is the ggp_table here which we want to add in the region of plot.
- vjust, hjust : Setting the horizontal and vertical adjust of the table
在继续之前,我们需要在 R 中安装并加载另一个名为ggpmisc 的库,它代表ggplot 的杂项扩展。要安装和加载在 R 控制台中写入以下命令:
install.packages(“ggpmisc”)
library(ggpmisc)
这个库有助于使用关键字将表格放在绘图区域中:
geom=”table” // inside the annotate function
例子:
电阻
library(ggplot2)
library(ggpmisc)

# Inserting data
vacc <- data.frame(catgry=rep(c("Covishield", "Covaxin"), each=2),
                   dose=rep(c("D1", "D2"),2),
                   slots=c(33, 45, 66, 50))
head(vacc)

# To create ggplot2 scatter plot
ggplot(vacc, aes(dose, slots, color = catgry))+
geom_point(shape=8,size = 5)+ annotate(geom = "table",x = 4,y = 12,
                                       label = list(cbind(vacc)))
输出:
