R 编程中的特征工程
特征工程是用于创建机器学习模型的最重要的技术。特征工程是一个基本术语,用于涵盖对变量(特征)执行的许多操作以使其适合算法。它有助于提高模型的准确性,从而增强预测结果。特征工程机器学习模型在数据上的表现优于基本机器学习模型。特征工程有以下几个方面:
- 特征缩放:完成相同比例的特征(例如欧几里德距离)。
- 特征转换:通过函数对数据(特征)进行归一函数。
- 特征构建:基于原始描述符创建新特征,以提高预测模型的准确性。
- 特征减少。 :这样做是为了提高预测模型的统计分布和准确性。
理论
特征构建方法有助于在数据中创建新特征,从而提高模型准确性和整体预测。它有两种类型:
- 分箱:分箱是为连续变量创建的。
- 编码:数值变量或特征由分类变量形成。
分档
分箱是为了为连续变量创建分箱,将它们转换为分类变量。有两种类型的分箱:无监督和有监督。
- 无监督分箱涉及自动和手动分箱。在自动分箱中,分箱是在没有人为干预的情况下创建的,并且是自动创建的。在手动分箱中,分箱是在人为干扰下创建的,我们指定要创建分箱的位置。
- 监督分箱涉及为连续变量创建分箱,同时还要考虑目标变量。
编码
编码是从分类变量创建数值变量或特征的过程。它是工业和每个模型构建过程中广泛使用的方法。它有两种类型:标签编码和一键编码。
- 标签编码涉及根据字母顺序为每个标签分配一个唯一的整数或值。它是最流行和最广泛使用的编码。
- One-hot Encoding涉及基于分类变量中的唯一值创建附加特征或变量,即类别中的每个唯一值都将作为新特征添加。
在 R 中的实现
数据集
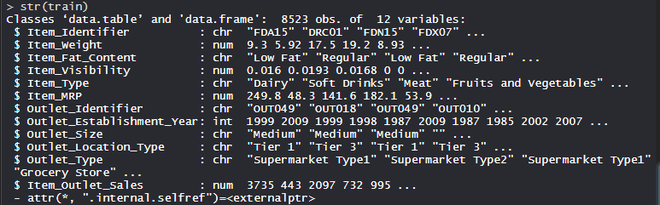
BigMart 数据集包含不同城市 10 家商店的 1559 种产品。已经定义了每个产品和商店的某些属性。它由 12 个特征组成,即 Item_Identifier(是分配给每个不同项目的唯一产品 ID)、Item_Weight(包括产品的重量)、Item_Fat_Content(描述产品是否低脂)、Item_Visibility(提到分配给特定产品的商店中所有产品的总展示面积)、Item_Type(描述该项目所属的食品类别)、Item_MRP(产品的最高零售价格(标价))、Outlet_Identifier(分配的唯一商店 ID。它由长度为 6 的字母数字字符串组成)、Outlet_Establishment_Year(提到商店成立的年份)、Outlet_Size(根据覆盖面积说明商店的大小)、Outlet_Location_Type(说明所在城市的大小)商店所在)、Outlet_Type(说明该商店是杂货店还是某种超市)和 Item_Outlet_Sales(特定商店中产品的销售额)。
R
# Loading data
train = fread("Train_UWu5bXk.csv")
test = fread("Test_u94Q5KV.csv")

# Structure
str(train)
R
# Loading packages
library(data.table) # used for reading and manipulation of data
library(dplyr)      # used for data manipulation and joining
library(ggplot2)    # used for ploting
library(caret)      # used for modeling
library(e1071)      # used for removing skewness
library(corrplot)   # used for making correlation plot
library(xgboost)    # used for building XGBoost model
library(cowplot)    # used for combining multiple plots

# Importing datasets
train = fread("Train_UWu5bXk.csv")
test = fread("Test_u94Q5KV.csv")

# Structure of dataset
str(train)

# Setting test dataset
# Combining datasets
# add Item_Outlet_Sales to test data
test[, Item_Outlet_Sales := NA]
combi = rbind(train, test)

# Missing Value Treatment
missing_index = which(is.na(combi$Item_Weight))
for(i in missing_index){
  item = combi$Item_Identifier[i]
  combi$Item_Weight[i] = mean(combi$Item_Weight
                         [combi$Item_Identifier == item],
                         na.rm = T)
}

# Feature Engineering
# Feature Transformation
# Replacing 0 in Item_Visibility with mean
zero_index = which(combi$Item_Visibility == 0)
for(i in zero_index){
  item = combi$Item_Identifier[i]
  combi$Item_Visibility[i] = mean(
    combi$Item_Visibility[combi$Item_Identifier == item],
    na.rm = T
  )
}

# Feature Construction
# Create a new feature 'Item_Type_new'
perishable = c("Breads", "Breakfast", "Dairy",
               "Fruits and Vegetables", "Meat", "Seafood")
non_perishable = c("Baking Goods", "Canned", "Frozen Foods",
                   "Hard Drinks", "Health and Hygiene",
                   "Household", "Soft Drinks")

combi[,Item_Type_new := ifelse(Item_Type %in% perishable, "perishable",
                               ifelse(Item_Type %in% non_perishable,
                                      "non_perishable", "not_sure"))]


combi[,Item_category := substr(combi$Item_Identifier, 1, 2)]

combi$Item_Fat_Content[combi$Item_category == "NC"] = "Non-Edible"

# Years of operation of Outlets
combi[,Outlet_Years := 2013 - Outlet_Establishment_Year]
combi$Outlet_Establishment_Year = as.factor(combi$Outlet_Establishment_Year)

# Price per unit weight
combi[,price_per_unit_wt := Item_MRP/Item_Weight]

# Label Encoding
combi[,Outlet_Size_num := ifelse(Outlet_Size == "Small", 0,
                                 ifelse(Outlet_Size == "Medium", 1, 2))]

combi[,Outlet_Location_Type_num := ifelse(Outlet_Location_Type == "Tier 3", 0,
                                   ifelse(Outlet_Location_Type == "Tier 2", 1, 2))]

combi[, c("Outlet_Size", "Outlet_Location_Type") := NULL]

# One-hot Encoding
ohe = dummyVars("~.", data = combi[,-c("Item_Identifier",
                                       "Outlet_Establishment_Year",
                                       "Item_Type")], fullRank = T)
ohe_df = data.table(predict(ohe, combi[,-c("Item_Identifier",
                                           "Outlet_Establishment_Year",
                                           "Item_Type")]))

combi = cbind(combi[,"Item_Identifier"], ohe_df)

# Removing Skewness
skewness(combi$Item_Visibility)
skewness(combi$price_per_unit_wt)

combi[,Item_Visibility := log(Item_Visibility + 1)]
combi[,price_per_unit_wt := log(price_per_unit_wt + 1)]

# Scaling and Centering data
# index of numeric features
num_vars = which(sapply(combi, is.numeric))
num_vars_names = names(num_vars)

combi_numeric = combi[,setdiff(num_vars_names,
                               "Item_Outlet_Sales"), with = F]

prep_num = preProcess(combi_numeric, method=c("center", "scale"))
combi_numeric_norm = predict(prep_num, combi_numeric)

# Transforming Features
combi[,setdiff(num_vars_names, "Item_Outlet_Sales") := NULL]

combi = cbind(combi, combi_numeric_norm)

# Splitting data
train = combi[1:nrow(train)]
test = combi[(nrow(train) + 1):nrow(combi)]

# Removing Item_Outlet_Sales
test[,Item_Outlet_Sales := NULL]

# Model Building - xgboost
para_list = list(
        objective = "reg:linear",
        eta=0.01,
        gamma = 1,
        max_depth=6,
        subsample=0.8,
        colsample_bytree=0.5
        )

# D Matrix
d_train = xgb.DMatrix(data = as.matrix(train[,-c("Item_Identifier",
                                                 "Item_Outlet_Sales")]),
                      label= train$Item_Outlet_Sales)
d_test = xgb.DMatrix(data = as.matrix(test[,-c("Item_Identifier")]))

# K-fold cross validation
set.seed(123) # Setting seed
xgb_cv = xgb.cv(params = para_list,
               data = d_train,
               nrounds = 1000,
               nfold = 5,
               print_every_n = 10,
               early_stopping_rounds = 30,
               maximize = F)

# Training model
model_xgb = xgb.train(data = d_train,
                      params = para_list,
                      nrounds = 428)

model_xgb

# Variable Importance Plot
variable_imp = xgb.importance(feature_names = setdiff(names(train),
                              c("Item_Identifier", "Item_Outlet_Sales")),
                              model = model_xgb)

xgb.plot.importance(variable_imp)
输出:
对数据集执行特征工程
在数据集上使用特征构建方法,该数据集包括 12 个特征,不同城市的 10 家商店的 1559 种产品。
电阻
# Loading packages
library(data.table) # used for reading and manipulation of data
library(dplyr)      # used for data manipulation and joining
library(ggplot2)    # used for ploting
library(caret)      # used for modeling
library(e1071)      # used for removing skewness
library(corrplot)   # used for making correlation plot
library(xgboost)    # used for building XGBoost model
library(cowplot)    # used for combining multiple plots

# Importing datasets
train = fread("Train_UWu5bXk.csv")
test = fread("Test_u94Q5KV.csv")

# Structure of dataset
str(train)

# Setting test dataset
# Combining datasets
# add Item_Outlet_Sales to test data
test[, Item_Outlet_Sales := NA]
combi = rbind(train, test)

# Missing Value Treatment
missing_index = which(is.na(combi$Item_Weight))
for(i in missing_index){
  item = combi$Item_Identifier[i]
  combi$Item_Weight[i] = mean(combi$Item_Weight
                         [combi$Item_Identifier == item],
                         na.rm = T)
}

# Feature Engineering
# Feature Transformation
# Replacing 0 in Item_Visibility with mean
zero_index = which(combi$Item_Visibility == 0)
for(i in zero_index){
  item = combi$Item_Identifier[i]
  combi$Item_Visibility[i] = mean(
    combi$Item_Visibility[combi$Item_Identifier == item],
    na.rm = T
  )
}

# Feature Construction
# Create a new feature 'Item_Type_new'
perishable = c("Breads", "Breakfast", "Dairy",
               "Fruits and Vegetables", "Meat", "Seafood")
non_perishable = c("Baking Goods", "Canned", "Frozen Foods",
                   "Hard Drinks", "Health and Hygiene",
                   "Household", "Soft Drinks")

combi[,Item_Type_new := ifelse(Item_Type %in% perishable, "perishable",
                               ifelse(Item_Type %in% non_perishable,
                                      "non_perishable", "not_sure"))]


combi[,Item_category := substr(combi$Item_Identifier, 1, 2)]

combi$Item_Fat_Content[combi$Item_category == "NC"] = "Non-Edible"

# Years of operation of Outlets
combi[,Outlet_Years := 2013 - Outlet_Establishment_Year]
combi$Outlet_Establishment_Year = as.factor(combi$Outlet_Establishment_Year)

# Price per unit weight
combi[,price_per_unit_wt := Item_MRP/Item_Weight]

# Label Encoding
combi[,Outlet_Size_num := ifelse(Outlet_Size == "Small", 0,
                                 ifelse(Outlet_Size == "Medium", 1, 2))]

combi[,Outlet_Location_Type_num := ifelse(Outlet_Location_Type == "Tier 3", 0,
                                   ifelse(Outlet_Location_Type == "Tier 2", 1, 2))]

combi[, c("Outlet_Size", "Outlet_Location_Type") := NULL]

# One-hot Encoding
ohe = dummyVars("~.", data = combi[,-c("Item_Identifier",
                                       "Outlet_Establishment_Year",
                                       "Item_Type")], fullRank = T)
ohe_df = data.table(predict(ohe, combi[,-c("Item_Identifier",
                                           "Outlet_Establishment_Year",
                                           "Item_Type")]))

combi = cbind(combi[,"Item_Identifier"], ohe_df)

# Removing Skewness
skewness(combi$Item_Visibility)
skewness(combi$price_per_unit_wt)

combi[,Item_Visibility := log(Item_Visibility + 1)]
combi[,price_per_unit_wt := log(price_per_unit_wt + 1)]

# Scaling and Centering data
# index of numeric features
num_vars = which(sapply(combi, is.numeric))
num_vars_names = names(num_vars)

combi_numeric = combi[,setdiff(num_vars_names,
                               "Item_Outlet_Sales"), with = F]

prep_num = preProcess(combi_numeric, method=c("center", "scale"))
combi_numeric_norm = predict(prep_num, combi_numeric)

# Transforming Features
combi[,setdiff(num_vars_names, "Item_Outlet_Sales") := NULL]

combi = cbind(combi, combi_numeric_norm)

# Splitting data
train = combi[1:nrow(train)]
test = combi[(nrow(train) + 1):nrow(combi)]

# Removing Item_Outlet_Sales
test[,Item_Outlet_Sales := NULL]

# Model Building - xgboost
para_list = list(
        objective = "reg:linear",
        eta=0.01,
        gamma = 1,
        max_depth=6,
        subsample=0.8,
        colsample_bytree=0.5
        )

# D Matrix
d_train = xgb.DMatrix(data = as.matrix(train[,-c("Item_Identifier",
                                                 "Item_Outlet_Sales")]),
                      label= train$Item_Outlet_Sales)
d_test = xgb.DMatrix(data = as.matrix(test[,-c("Item_Identifier")]))

# K-fold cross validation
set.seed(123) # Setting seed
xgb_cv = xgb.cv(params = para_list,
               data = d_train,
               nrounds = 1000,
               nfold = 5,
               print_every_n = 10,
               early_stopping_rounds = 30,
               maximize = F)

# Training model
model_xgb = xgb.train(data = d_train,
                      params = para_list,
                      nrounds = 428)

model_xgb

# Variable Importance Plot
variable_imp = xgb.importance(feature_names = setdiff(names(train),
                              c("Item_Identifier", "Item_Outlet_Sales")),
                              model = model_xgb)

xgb.plot.importance(variable_imp)
输出:
- 模型model_xgb:
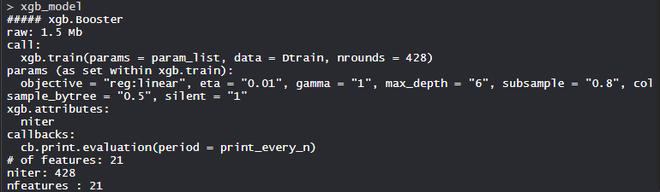
XgBoost 模型由 21 个特征组成,目标是回归线性,eta 为 0.01,gamma 为 1,max_depth 为 6,colsample_bytree = 0.5,silent 为 1。
- 变量重要性图:
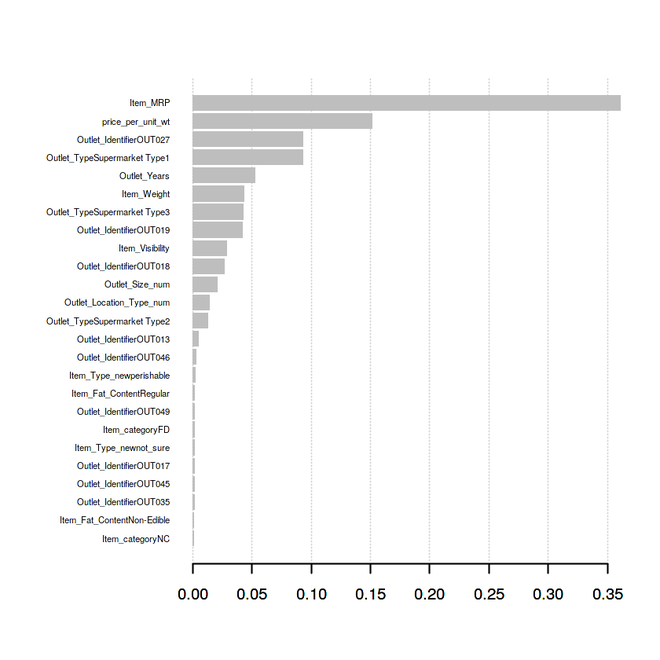
price_per_unit_wt 是预测模型的第二个最重要的变量或特征,其次是 Outlet_Years 是预测模型的第六个最重要的变量或特征。 Item_category, Item_Type_new 特征在改进预测模型从而提高模型准确性方面发挥了主要作用。因此,特征工程是构建高效、可扩展和准确的预测模型的最重要方法。