- K 最近邻与Python |机器学习(1)
- K 最近邻与Python |机器学习
- 机器学习算法(1)
- 机器学习算法
- KNN算法-查找最近的邻居
- KNN算法-查找最近的邻居(1)
- Scikit学习-K最近邻居(KNN)(1)
- Scikit学习-K最近邻居(KNN)
- Scikit学习-KNN学习
- Scikit学习-KNN学习(1)
- 机器学习 (1)
- 机器学习中的 P 值(1)
- C++中的机器学习(1)
- C++中的机器学习
- 机器学习中的 P 值
- 机器学习-分类算法
- 机器学习-分类算法(1)
- 机器学习-Scikit学习算法
- 机器学习-Scikit学习算法(1)
- Python中的k最近邻算法(1)
- Python中的k最近邻算法
- 机器学习 python (1)
- 机器学习 python 代码示例
- 机器学习 - 任何代码示例
- 机器学习-什么是P值
- 什么是机器学习?(1)
- 在机器学习中什么是“i” (1)
- 什么是机器学习?
- 机器学习-什么是P值(1)
📅 最后修改于: 2020-09-27 09:02:38 🧑 作者: Mango
机器学习的K最近邻(KNN)算法
- K最近邻居是基于监督学习技术的最简单的机器学习算法之一。
- K-NN算法假定新案例/数据与可用案例之间具有相似性,并将新案例放入与可用类别最相似的类别中。
- K-NN算法存储所有可用数据,并基于相似度对新数据点进行分类。这意味着,当出现新数据时,可以使用K-NN算法将其轻松分类为钻井套件类别。
- K-NN算法既可以用于回归也可以用于分类,但是大多数情况下用于分类问题。
- K-NN是一种非参数算法 ,这意味着它不会对基础数据进行任何假设。
- 它也称为惰性学习器算法,因为它不立即从训练集中学习,而是存储数据集,并且在分类时对数据集执行操作。
- 训练阶段的KNN算法仅存储数据集,并在获取新数据时将其分类为与新数据非常相似的类别。
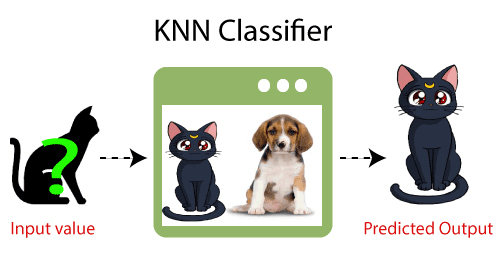
- 示例:假设我们有一个看起来类似于猫和狗的生物的图像,但是我们想知道它是猫还是狗。因此,对于这种识别,我们可以使用KNN算法,因为它适用于相似性度量。我们的KNN模型将发现新数据集与猫和狗图像相似的特征,并基于最相似的特征将其分类为猫或狗类别。
为什么我们需要K-NN算法?
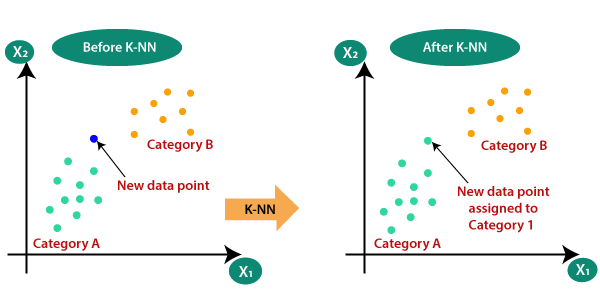
假设有两个类别,即类别A和类别B,并且我们有一个新的数据点x1,因此此数据点将位于这些类别中的哪个类别中。为了解决这类问题,我们需要一种K-NN算法。借助K-NN,我们可以轻松识别特定数据集的类别或类别。考虑下图:
K-NN如何工作?
K-NN的工作可以根据以下算法进行解释:
- 步骤1:选择邻居的数字K
- 步骤2:计算K个邻居的欧几里得距离
- 步骤3:根据计算出的欧几里得距离取K个最近的邻居。
- 步骤4:在这k个邻居中,计算每个类别中数据点的数量。
- 步骤5:将新的数据点分配给该类别的邻居数量最大。
- 步骤6:模型已经准备就绪。
假设我们有一个新的数据点,我们需要将其放在所需的类别中。考虑下图:

- 首先,我们将选择邻居数,因此我们将选择k = 5。
- 接下来,我们将计算数据点之间的欧几里得距离 。欧几里德距离是两点之间的距离,我们已经在几何学中对其进行了研究。可以计算为:
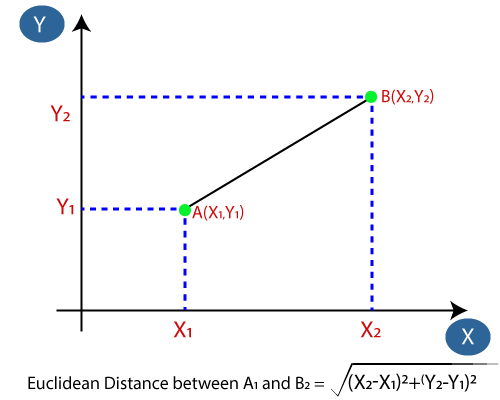
- 通过计算欧几里得距离,我们得到了最近的邻居,即A类中的三个最近邻居和B类中的两个最近邻居。请看下面的图片:
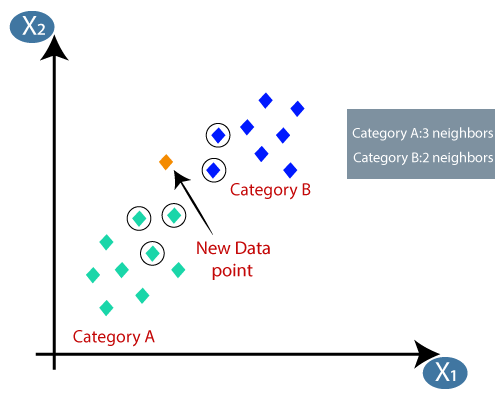
- 如我们所见,最近的三个邻居来自类别A,因此此新数据点必须属于类别A。
如何在K-NN算法中选择K的值?
在K-NN算法中选择K的值时,要记住以下几点:
- 没有确定“ K”的最佳值的特定方法,因此我们需要尝试一些值以从中找出最佳值。 K的最优选值为5。
- K的极低值(例如K = 1或K = 2)可能会产生噪声,并导致模型中异常值的影响。
- 较大的K值不错,但可能会遇到一些困难。
KNN算法的优点:
- 它很容易实现。
- 它对嘈杂的训练数据具有鲁棒性
- 如果训练数据很大,可能会更有效。
KNN算法的缺点:
- 始终需要确定K的值,该值有时可能很复杂。
- 由于计算所有训练样本的数据点之间的距离,因此计算成本很高。
KNN算法的Python实现
为了执行K-NN算法的Python实现,我们将使用与Logistic回归中相同的问题和数据集。但是这里我们将改善模型的性能。问题描述如下:
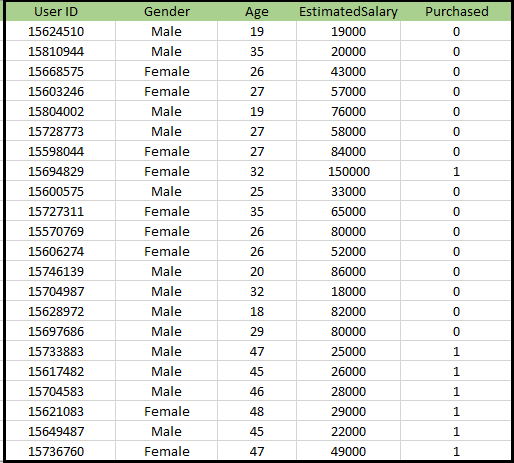
K-NN算法的问题:有一家汽车制造商公司制造了一辆新的SUV汽车。该公司希望将广告投放给有兴趣购买该SUV的用户。因此对于这个问题,我们有一个数据集,该数据集包含通过社交网络的多个用户信息。数据集包含大量信息,但是我们将考虑自变量的估计薪资和年龄,而已购买变量则用于因变量。以下是数据集:
实现K-NN算法的步骤:
- 数据预处理步骤
- 使K-NN算法适合训练集
- 预测测试结果
- 测试结果的准确性(创建混淆矩阵)
- 可视化测试集结果。
数据预处理步骤:
数据预处理步骤将与Logistic回归完全相同。下面是它的代码:
# importing libraries
import numpy as nm
import matplotlib.pyplot as mtp
import pandas as pd

#importing datasets
data_set= pd.read_csv('user_data.csv')

#Extracting Independent and dependent Variable
x= data_set.iloc[:, [2,3]].values
y= data_set.iloc[:, 4].values

# Splitting the dataset into training and test set.
from sklearn.model_selection import train_test_split
x_train, x_test, y_train, y_test= train_test_split(x, y, test_size= 0.25, random_state=0)

#feature Scaling
from sklearn.preprocessing import StandardScaler
st_x= StandardScaler()
x_train= st_x.fit_transform(x_train)
x_test= st_x.transform(x_test)
通过执行上述代码,我们的数据集将导入到我们的程序中并进行了充分的预处理。功能缩放后,我们的测试数据集将如下所示:
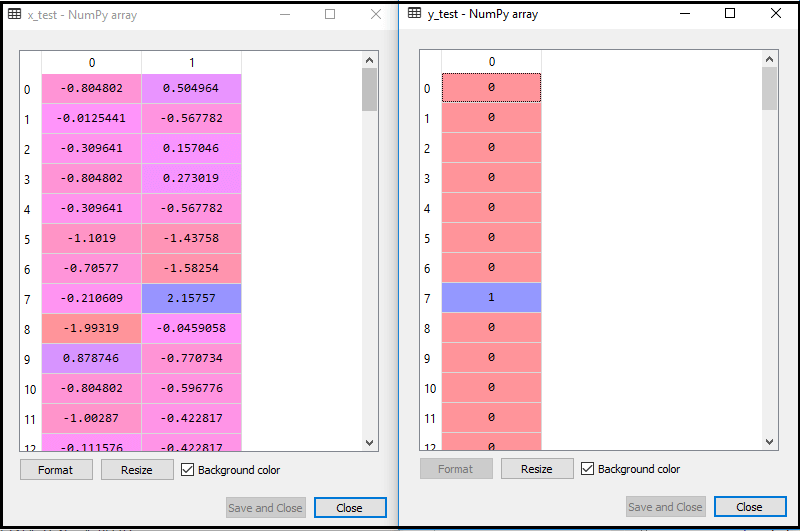
从上面的输出图像中,我们可以看到我们的数据已成功缩放。
- 使K-NN分类器适合训练数据:
现在,我们将K-NN分类器拟合到训练数据。为此,我们将导入Sklearn Neighbors库的KNeighborsClassifier类。导入该类后,我们将创建该类的Classifier对象。此类的参数为- n_neighbors:定义算法所需的邻居。通常需要5。
- metric =’minkowski’:这是默认参数,它决定点之间的距离。
- p = 2:等同于标准欧几里得度量。
然后,我们将分类器适合训练数据。下面是它的代码:
#Fitting K-NN classifier to the training set
from sklearn.neighbors import KNeighborsClassifier
classifier= KNeighborsClassifier(n_neighbors=5, metric='minkowski', p=2 )
classifier.fit(x_train, y_train)
输出:通过执行上述代码,我们将获得以下输出:
Out[10]:
KNeighborsClassifier(algorithm='auto', leaf_size=30, metric='minkowski',
                     metric_params=None, n_jobs=None, n_neighbors=5, p=2,
                     weights='uniform')
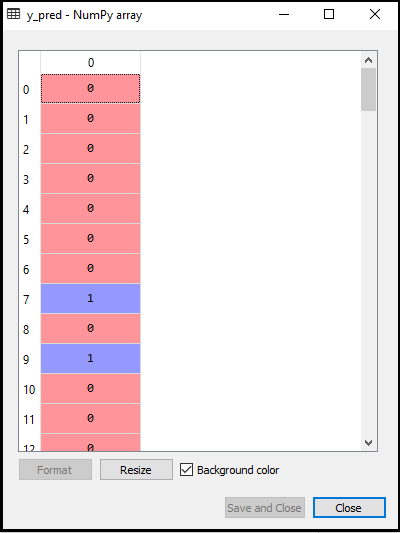
- 预测测试结果:要预测测试集结果,我们将像在Logistic回归中一样创建一个y_pred向量。下面是它的代码:
#Predicting the test set result
y_pred= classifier.predict(x_test)
输出:
上面代码的输出将是:
- 创建混淆矩阵:
现在,我们将为我们的K-NN模型创建混淆矩阵,以查看分类器的准确性。下面是它的代码:
#Creating the Confusion matrix
    from sklearn.metrics import confusion_matrix
    cm= confusion_matrix(y_test, y_pred)
在上面的代码中,我们导入了confusion_matrix 函数 ,并使用变量cm对其进行了调用。
输出:通过执行上述代码,我们将得到如下矩阵:
在上图中,我们可以看到有64 + 29 = 93个正确的预测和3 + 4 = 7个错误的预测,而在Logistic回归中,有11个错误的预测。因此,可以说使用K-NN算法可以提高模型的性能。
- 可视化训练集结果:
现在,我们将可视化K-NN模型的训练集结果。除了图的名称外,代码将保持与Logistic回归中的代码相同。下面是它的代码:
#Visulaizing the trianing set result
from matplotlib.colors import ListedColormap
x_set, y_set = x_train, y_train
x1, x2 = nm.meshgrid(nm.arange(start = x_set[:, 0].min() - 1, stop = x_set[:, 0].max() + 1, step  =0.01),
nm.arange(start = x_set[:, 1].min() - 1, stop = x_set[:, 1].max() + 1, step = 0.01))
mtp.contourf(x1, x2, classifier.predict(nm.array([x1.ravel(), x2.ravel()]).T).reshape(x1.shape),
alpha = 0.75, cmap = ListedColormap(('red','green' )))
mtp.xlim(x1.min(), x1.max())
mtp.ylim(x2.min(), x2.max())
for i, j in enumerate(nm.unique(y_set)):
    mtp.scatter(x_set[y_set == j, 0], x_set[y_set == j, 1],
        c = ListedColormap(('red', 'green'))(i), label = j)
mtp.title('K-NN Algorithm (Training set)')
mtp.xlabel('Age')
mtp.ylabel('Estimated Salary')
mtp.legend()
mtp.show()
输出:
通过执行以上代码,我们将得到下图:

输出图与我们在Logistic回归中出现的图不同。从以下几点可以理解:
-
- 如我们所见,图形显示了红点和绿点。绿点代表Purchased(1),红点代表not Purchased(0)变量。
- 该图显示的是不规则边界,而不是显示任何直线或曲线,因为它是K-NN算法,即查找最近的邻居。
- 该图将用户分类为正确的类别,因为大多数未购买SUV的用户位于红色区域,而购买SUV的用户位于绿色区域。
- 该图显示出良好的结果,但红色区域中仍有一些绿色点,绿色区域中有一些红色点。但这不是什么大问题,因为通过执行此模型可以防止过拟合问题。
- 因此,我们的模型训练有素。
- 可视化测试集结果:
训练完模型后,我们现在将放置一个新的数据集(即测试数据集)来测试结果。除了一些小的更改外,代码保持不变:例如x_train和y_train将由x_test和y_test代替 。
下面是它的代码:
#Visualizing the test set result
from matplotlib.colors import ListedColormap
x_set, y_set = x_test, y_test
x1, x2 = nm.meshgrid(nm.arange(start = x_set[:, 0].min() - 1, stop = x_set[:, 0].max() + 1, step  =0.01),
nm.arange(start = x_set[:, 1].min() - 1, stop = x_set[:, 1].max() + 1, step = 0.01))
mtp.contourf(x1, x2, classifier.predict(nm.array([x1.ravel(), x2.ravel()]).T).reshape(x1.shape),
alpha = 0.75, cmap = ListedColormap(('red','green' )))
mtp.xlim(x1.min(), x1.max())
mtp.ylim(x2.min(), x2.max())
for i, j in enumerate(nm.unique(y_set)):
    mtp.scatter(x_set[y_set == j, 0], x_set[y_set == j, 1],
        c = ListedColormap(('red', 'green'))(i), label = j)
mtp.title('K-NN algorithm(Test set)')
mtp.xlabel('Age')
mtp.ylabel('Estimated Salary')
mtp.legend()
mtp.show()
输出:
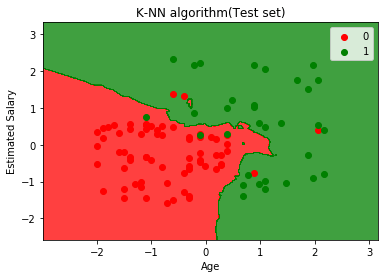
上图显示了测试数据集的输出。从图中可以看出,由于大多数红点位于红色区域,而大多数绿点位于绿色区域,因此预测输出效果很好。
但是,红色区域中的绿点很少,绿色区域中的红点很少。因此,这些是我们在混淆矩阵中观察到的错误观察结果(7错误输出)。