Matplotlib 中的箭袋图
箭袋图基本上是一种将矢量线显示为箭头的二维图。这种类型的绘图在电气工程师中很有用,可以在机械工程中可视化电势并显示应力梯度。
创建箭袋图
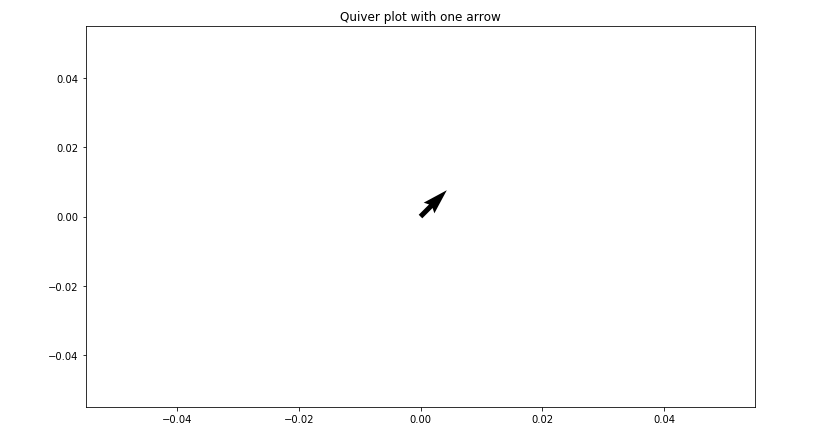
让我们开始创建一个简单的箭袋图,其中包含一个箭头,它将解释 Matplotlib 的 ax.quiver()函数是如何工作的。 ax.quiver()函数有四个参数:
句法:
ax.quiver(x_pos, y_pos, x_dir, y_dir, color) 这里 x_pos 和 y_pos 是箭头的起始位置,而 x_dir 和 y_dir 是箭头的方向。
下图包含一个从 x_pos = 0 和 y_pos = 0 开始的颤动箭头。箭头的方向在 x_dir = 1 和 y_dir = 1 处指向上方和右侧。
例子:
Python3
# Import libraries
import numpy as np
import matplotlib.pyplot as plt


# Creating arrow
x_pos = 0
y_pos = 0
x_direct = 1
y_direct = 1

# Creating plot
fig, ax = plt.subplots(figsize = (12, 7))
ax.quiver(x_pos, y_pos, x_direct, y_direct)
ax.set_title('Quiver plot with one arrow')

# Show plot
plt.show()
Python3
# Import libraries
import numpy as np
import matplotlib.pyplot as plt


# Creating arrow
x_pos = [0, 0]
y_pos = [0, 0]
x_direct = [1, 0]
y_direct = [1, -1]

# Creating plot
fig, ax = plt.subplots(figsize = (12, 7))
ax.quiver(x_pos, y_pos, x_direct, y_direct,
         scale = 5)

ax.axis([-1.5, 1.5, -1.5, 1.5])

# show plot
plt.show()
Python3
# Import libraries
import numpy as np
import matplotlib.pyplot as plt


# Creating arrow
x = np.arange(0, 2.2, 0.2)
y = np.arange(0, 2.2, 0.2)

X, Y = np.meshgrid(x, y)
u = np.cos(X)*Y
v = np.sin(Y)*Y

# creating plot
fig, ax = plt.subplots(figsize =(14, 8))
ax.quiver(X, Y, u, v)

ax.xaxis.set_ticks([])
ax.yaxis.set_ticks([])
ax.axis([-0.3, 2.3, -0.3, 2.3])
ax.set_aspect('equal')

# show plot
plt.show()
Python3
# Import libraries
import numpy as np
import matplotlib.pyplot as plt


# Creating arrows
x = np.arange(-2, 2.2, 0.2)
y = np.arange(-2, 2.2, 0.2)

# Creating gradient
X, Y = np.meshgrid(x, y)
z = X * np.exp(-X**2-Y**2)
dx, dy = np.gradient(z)

# Creating plot
fig, ax = plt.subplots(figsize =(9, 9))
ax.quiver(X, Y, dx, dy)

ax.xaxis.set_ticks([])
ax.yaxis.set_ticks([])
ax.set_aspect('equal')

# show plot
plt.show()
Python3
# Import libraries
import numpy as np
import matplotlib.pyplot as plt

# Defining subplots
fig, (ax1, ax2) = plt.subplots(1, 2, figsize =(14, 8))


# first subplot
# Creating arrows
x = np.arange(0, 2.2, 0.2)
y = np.arange(0, 2.2, 0.2)
X, Y = np.meshgrid(x, y)
u = np.cos(X)*Y
v = np.sin(y)*Y
n = -2

# Defining color
color = np.sqrt(((v-n)/2)*2 + ((u-n)/2)*2)

# Creating plot
ax1.quiver(X, Y, u, v, color, alpha = 0.8)
ax1.xaxis.set_ticks([])
ax1.yaxis.set_ticks([])
ax1.axis([-0.2, 2.3, -0.2, 2.3])
ax1.set_aspect('equal')
ax1.set_title('meshgrid function')

# second subplot
# Creating arrows
x = np.arange(-2, 2.2, 0.2)
y = np.arange(-2, 2.2, 0.2)
X, Y = np.meshgrid(x, y)
z = X * np.exp(-X**2 -Y**2)
dx, dy = np.gradient(z)
n = -2

# Defining color
color = np.sqrt(((dx-n)/2)*2 + ((dy-n)/2)*2)

# Creating plot
ax2.quiver(X, Y, dx, dy, color)
ax2.xaxis.set_ticks([])
ax2.yaxis.set_ticks([])
ax2.set_aspect('equal')
ax2.set_title('gradient')


# show figure
plt.tight_layout()
plt.show()
Python3
# Import libraries
import numpy as np
import matplotlib.pyplot as plt

# Creating arrow
x = np.arange(0, 2 * np.pi + 2 * np.pi / 20,
              2 * np.pi / 20)
y = np.arange(0, 2 * np.pi + 2 * np.pi / 20,
              2 * np.pi / 20)

X, Y = np.meshgrid(x, y)

u = np.sin(X)*np.cos(Y)
v = -np.cos(X)*np.sin(Y)

# Defining color
color = np.sqrt(((dx-n)/2)*2 + ((dy-n)/2)*2)

# Creating plot
fig, ax = plt.subplots(figsize =(14, 9))
ax.quiver(X, Y, u, v, color, alpha = 1)

ax.xaxis.set_ticks([])
ax.yaxis.set_ticks([])
ax.axis([0, 2 * np.pi, 0, 2 * np.pi])
ax.set_aspect('equal')

# show plot
plt.show()
输出 :
带有两个箭头的箭袋图
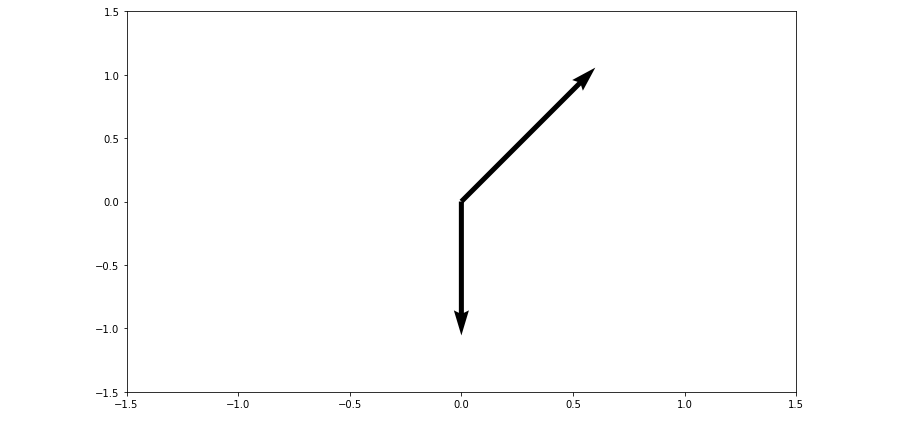
让我们在图中添加另一个箭头,穿过两个起点和两个方向。通过保持原始箭头从原点(0, 0)开始并指向向上和向右的方向(1, 1),并创建从 (0, 0) 开始的第二个箭头指向向下的方向(0, -1) .为了清楚地看到起点和终点,我们将使用方法 ax.axis() 将轴限制设置为 [-1.5, 1.5] 并以 [x_min, x_max, y_max, y_min] 的形式传递参数。通过在 ax.quiver() 方法中添加一个额外的参数 scale=value,我们可以管理箭头的长度,使其看起来更长并且在绘图上显示得更好。
例子:
Python3
# Import libraries
import numpy as np
import matplotlib.pyplot as plt


# Creating arrow
x_pos = [0, 0]
y_pos = [0, 0]
x_direct = [1, 0]
y_direct = [1, -1]

# Creating plot
fig, ax = plt.subplots(figsize = (12, 7))
ax.quiver(x_pos, y_pos, x_direct, y_direct,
         scale = 5)

ax.axis([-1.5, 1.5, -1.5, 1.5])

# show plot
plt.show()
输出 :
使用网格网格绘制箭袋
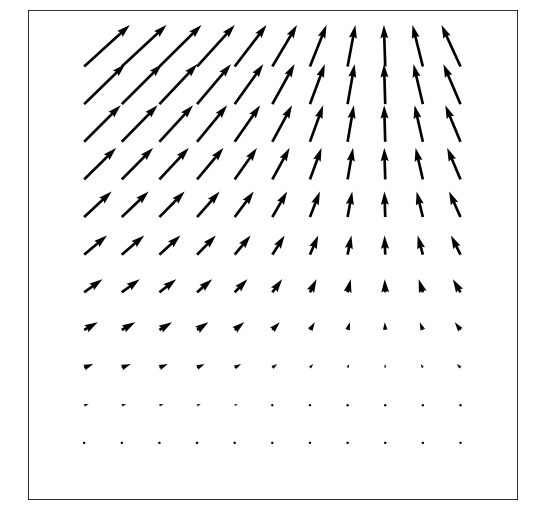
包含两个箭头的箭袋图是一个好的开始,但是将箭头一个一个地添加到箭袋图中太慢且太长。因此,要创建一个完全二维的箭头表面,我们将使用 Numpy 的 meshgrid() 方法。首先,创建一组名为 X 和 Y 的数组,它们分别表示箭袋图上每个箭头的 x 和 y 的起始位置。 x、y 箭头的起始位置也可用于定义每个箭头方向的 x 和 y 分量。在下图中,u 和 v 表示箭袋箭头的方向数组,我们将使用以下等式根据箭头起点定义箭头方向:
x_{direction} = cos(x_{starting \ point})
y_{direction} = sin(y_{starting \ point})
例子:
Python3
# Import libraries
import numpy as np
import matplotlib.pyplot as plt


# Creating arrow
x = np.arange(0, 2.2, 0.2)
y = np.arange(0, 2.2, 0.2)

X, Y = np.meshgrid(x, y)
u = np.cos(X)*Y
v = np.sin(Y)*Y

# creating plot
fig, ax = plt.subplots(figsize =(14, 8))
ax.quiver(X, Y, u, v)

ax.xaxis.set_ticks([])
ax.yaxis.set_ticks([])
ax.axis([-0.3, 2.3, -0.3, 2.3])
ax.set_aspect('equal')

# show plot
plt.show()
输出 :
使用渐变的箭袋图
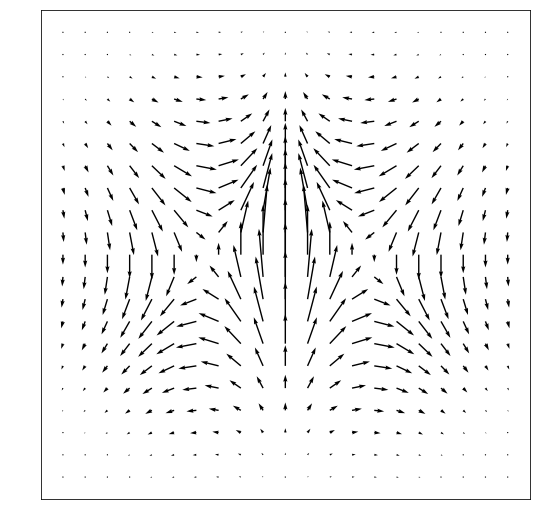
让我们创建一个显示梯度函数的颤动图。 Numpy 的 np, gradient() 方法可用于将梯度函数应用于每个箭头的 x, y 起始位置。该等式用于创建以下图:
z = xe^{-x^2-y^2}例子:
Python3
# Import libraries
import numpy as np
import matplotlib.pyplot as plt


# Creating arrows
x = np.arange(-2, 2.2, 0.2)
y = np.arange(-2, 2.2, 0.2)

# Creating gradient
X, Y = np.meshgrid(x, y)
z = X * np.exp(-X**2-Y**2)
dx, dy = np.gradient(z)

# Creating plot
fig, ax = plt.subplots(figsize =(9, 9))
ax.quiver(X, Y, dx, dy)

ax.xaxis.set_ticks([])
ax.yaxis.set_ticks([])
ax.set_aspect('equal')

# show plot
plt.show()
输出 :
着色箭袋图
Python matplotlib 库的 ax.quiver() 方法提供了一个可选的属性 color 来指定箭头的颜色。 quiver 颜色属性需要与位置和方向数组相同的维度。
下面是修改我们之前制作的箭袋图的代码:
示例 1:
Python3
# Import libraries
import numpy as np
import matplotlib.pyplot as plt

# Defining subplots
fig, (ax1, ax2) = plt.subplots(1, 2, figsize =(14, 8))


# first subplot
# Creating arrows
x = np.arange(0, 2.2, 0.2)
y = np.arange(0, 2.2, 0.2)
X, Y = np.meshgrid(x, y)
u = np.cos(X)*Y
v = np.sin(y)*Y
n = -2

# Defining color
color = np.sqrt(((v-n)/2)*2 + ((u-n)/2)*2)

# Creating plot
ax1.quiver(X, Y, u, v, color, alpha = 0.8)
ax1.xaxis.set_ticks([])
ax1.yaxis.set_ticks([])
ax1.axis([-0.2, 2.3, -0.2, 2.3])
ax1.set_aspect('equal')
ax1.set_title('meshgrid function')

# second subplot
# Creating arrows
x = np.arange(-2, 2.2, 0.2)
y = np.arange(-2, 2.2, 0.2)
X, Y = np.meshgrid(x, y)
z = X * np.exp(-X**2 -Y**2)
dx, dy = np.gradient(z)
n = -2

# Defining color
color = np.sqrt(((dx-n)/2)*2 + ((dy-n)/2)*2)

# Creating plot
ax2.quiver(X, Y, dx, dy, color)
ax2.xaxis.set_ticks([])
ax2.yaxis.set_ticks([])
ax2.set_aspect('equal')
ax2.set_title('gradient')


# show figure
plt.tight_layout()
plt.show()
输出 :
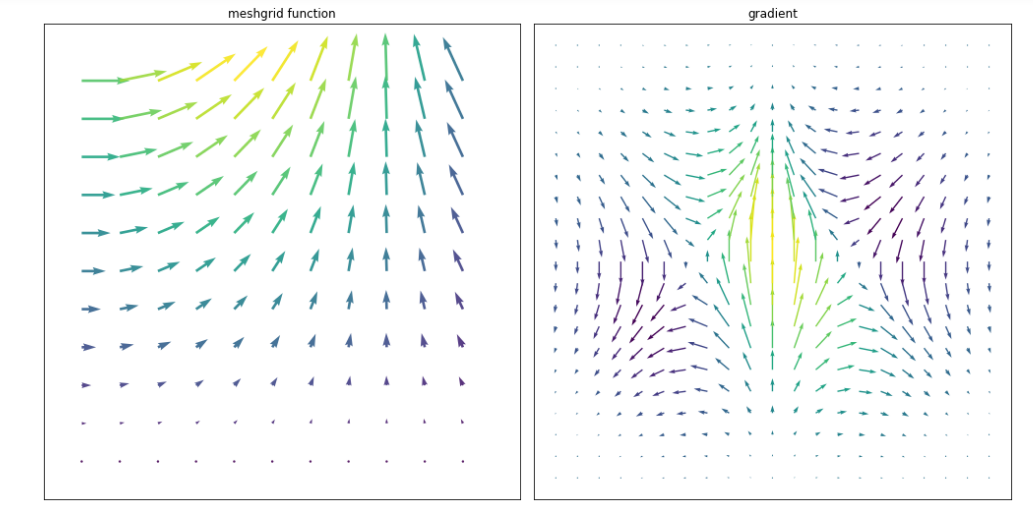
示例 2:构建函数的颤动图![]() 它定义了具有四个顶点的 2D 字段,如下图所示:
它定义了具有四个顶点的 2D 字段,如下图所示:
Python3
# Import libraries
import numpy as np
import matplotlib.pyplot as plt

# Creating arrow
x = np.arange(0, 2 * np.pi + 2 * np.pi / 20,
              2 * np.pi / 20)
y = np.arange(0, 2 * np.pi + 2 * np.pi / 20,
              2 * np.pi / 20)

X, Y = np.meshgrid(x, y)

u = np.sin(X)*np.cos(Y)
v = -np.cos(X)*np.sin(Y)

# Defining color
color = np.sqrt(((dx-n)/2)*2 + ((dy-n)/2)*2)

# Creating plot
fig, ax = plt.subplots(figsize =(14, 9))
ax.quiver(X, Y, u, v, color, alpha = 1)

ax.xaxis.set_ticks([])
ax.yaxis.set_ticks([])
ax.axis([0, 2 * np.pi, 0, 2 * np.pi])
ax.set_aspect('equal')

# show plot
plt.show()
输出 :
