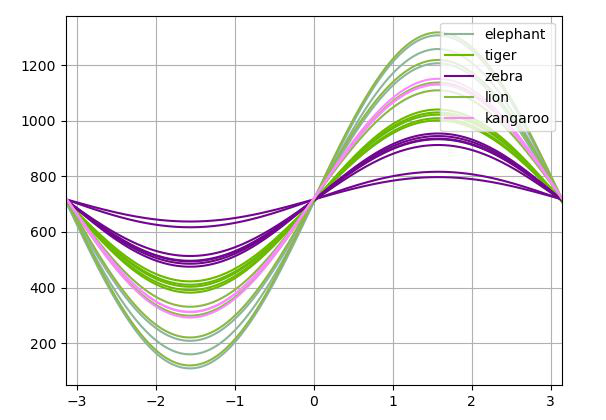
如何在Python中使用 Pandas 绘制安德鲁斯曲线?
安德鲁斯曲线用于通过将每个观察映射到一个函数来可视化高维数据。它保留了均值、距离和方差。它由公式给出:
T(n) = x_1/sqrt(2) + x_2 sin(n) + x_3 cos(n) + x_4 sin(2n) + x_5 cos(2n) + …
可以使用绘图的andrews_curves()方法在图形上绘制安德鲁斯曲线 模块。此函数生成 Andrews 曲线的 matplotlib 图,用于可视化多变量数据的集群。
Syntax: andrews_curves(frame, class_column, ax=None, samples=200, color=None, colormap=None, **kwargs)
Parameters:
- frame: It is the data to be plotted.
- class_column: This is the name of the column containing class names.
- ax: This parameter is a matplotlib axes object. Its default value is None.
- samples: This parameter is the number of points to plot in each curve.
- color: This parameter is an optional parameter and it is the list or tuple of colors to use for the different classes.
- colormap: This parameter is the string/matplotlib colormap object. Its default value is None.
Returns: This function returns an object of class matplotlip.axis.Axes
示例 1:在以下示例中,数据框由 CSV 文件制成,数据框用于绘制 andrews_curves。使用的 CSV 文件在这里。
Python3
# importing various package
import pandas as pd
import numpy as np
import matplotlib.pyplot as plt

# making data frame from csv file
df = pd.read_csv(
    'C:\\Users\\digital india\\Desktop\\pand.csv'
)

# Creating Andrews curves
x = pd.plotting.andrews_curves(df, 'animal')

# ploting the Curve
x.plot()

# Display
plt.show()
Python3
# importing various package
import pandas as pd
import numpy as np
import matplotlib.pyplot as plt

# making data frame from csv file
df = pd.read_csv(
    'https://raw.github.com/pandas-dev/'
    'pandas/master/pandas/tests/io/data/csv/iris.csv'
)

# Creating Andrews curves
x = pd.plotting.andrews_curves(df, 'Name')

# ploting the Curve
x.plot()

# Display
plt.show()
输出:
示例 2:
Python3
# importing various package
import pandas as pd
import numpy as np
import matplotlib.pyplot as plt

# making data frame from csv file
df = pd.read_csv(
    'https://raw.github.com/pandas-dev/'
    'pandas/master/pandas/tests/io/data/csv/iris.csv'
)

# Creating Andrews curves
x = pd.plotting.andrews_curves(df, 'Name')

# ploting the Curve
x.plot()

# Display
plt.show()
输出:

