R 中的 apply()、lapply()、sapply() 和 tapply()
在本文中,我们将了解 R 编程语言中的 apply()、lapply()、sapply() 和 tapply() 函数。
apply() 集合是 R 基本包的一部分。这一系列函数帮助我们将某个函数应用于某个数据框、列表或向量,并根据我们使用的函数将结果作为列表或向量返回。 apply()函数族中有以下四种函数:
应用()函数
apply()函数让我们可以将函数应用于矩阵或数据框的行或列。此函数将矩阵或数据框作为参数以及函数以及是否必须按行或列应用,并以向量或数组或获得的值列表的形式返回结果。
Syntax: apply( x, margin, function )
Parameters:
- x: determines the input array including matrix.
- margin: If the margin is 1 function is applied across row, if the margin is 2 it is applied across the column.
- function: determines the function that is to be applied on input data.
例子:
这是一个基本示例,展示了沿行和列使用 apply()函数。
R
# create sample data
sample_matrix <- matrix(C<-(1:10),nrow=3, ncol=10)

print( "sample matrix:")
sample_matrix

# Use apply() function across row to find sum
print("sum across rows:")
apply( sample_matrix, 1, sum)

# use apply() function across column to find mean
print("mean across columns:")
apply( sample_matrix, 2, mean)
R
# create sample data
names <- c("priyank", "abhiraj","pawananjani",
           "sudhanshu","devraj")
print( "original data:")
names

# apply lapply() function
print("data after lapply():")
lapply(names, toupper)
R
# create sample data
sample_data<- data.frame( x=c(1,2,3,4,5,6),
                          y=c(3,2,4,2,34,5))
print( "original data:")
sample_data

# apply sapply() function
print("data after sapply():")
sapply(sample_data, max)
R
# load library tidyverse
library(tidyverse)

# print head of diamonds dataset
print(" Head of data:")
head(diamonds)

# apply tapply function to get average price by cut
print("Average price for each cut of diamond:")
tapply(diamonds$price, diamonds$cut, mean)
输出:
lapply()函数
lapply()函数帮助我们在列表对象上应用函数并返回相同长度的列表对象。 R 语言中的 lapply()函数将列表、向量或数据框作为输入,并以列表对象的形式给出输出。由于 lapply()函数将某个操作应用于列表的所有元素,因此它不需要 MARGIN。
Syntax: lapply( x, fun )
Parameters:
- x: determines the input vector or an object.
- fun: determines the function that is to be applied to input data.
例子:
这是一个基本示例,展示了对向量使用 lapply()函数。
R
# create sample data
names <- c("priyank", "abhiraj","pawananjani",
           "sudhanshu","devraj")
print( "original data:")
names

# apply lapply() function
print("data after lapply():")
lapply(names, toupper)
输出:
sapply()函数
sapply()函数帮助我们在列表、向量或数据框上应用函数,并返回相同长度的数组或矩阵对象。 R 语言中的 sapply()函数将列表、向量或数据框作为输入,并以数组或矩阵对象的形式给出输出。由于 sapply()函数将某个操作应用于对象的所有元素,因此它不需要 MARGIN。它与 lapply() 相同,唯一的区别是返回对象的类型。
Syntax: sapply( x, fun )
Parameters:
- x: determines the input vector or an object.
- fun: determines the function that is to be applied to input data.
例子:
这是一个基本示例,展示了对向量使用 sapply()函数。
R
# create sample data
sample_data<- data.frame( x=c(1,2,3,4,5,6),
                          y=c(3,2,4,2,34,5))
print( "original data:")
sample_data

# apply sapply() function
print("data after sapply():")
sapply(sample_data, max)
输出:
tapply()函数
tapply() 帮助我们为向量中的每个因子变量计算统计度量(平均值、中值、最小值、最大值等)或自写函数操作。它帮助我们创建向量的子集,然后将一些函数应用于每个子集。例如,在一个组织中,如果我们有员工的工资数据,并且我们想找到男性和女性的平均工资,那么我们可以使用 tapply()函数,将男性和女性作为因子变量性别。
Syntax: tapply( x, index, fun )
Parameters:
- x: determines the input vector or an object.
- index: determines the factor vector that helps us distinguish the data.
- fun: determines the function that is to be applied to input data.
例子:
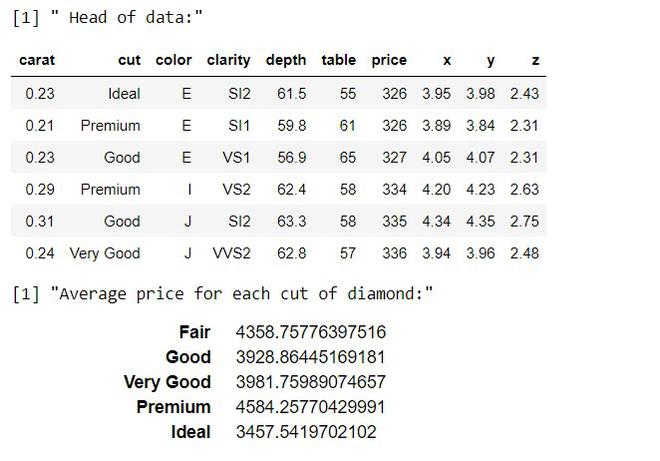
这是一个基本示例,展示了在 tidyverse 包库提供的 diamonds 数据集上使用 tapply()函数。
R
# load library tidyverse
library(tidyverse)

# print head of diamonds dataset
print(" Head of data:")
head(diamonds)

# apply tapply function to get average price by cut
print("Average price for each cut of diamond:")
tapply(diamonds$price, diamonds$cut, mean)
输出:


