确定数据挖掘中的簇数
在像 K-Means 聚类这样的聚类算法中,我们必须为我们的数据集确定正确的聚类数。这可确保正确有效地划分数据。适当的“k”值,即簇的数量,有助于确保簇的适当粒度,并有助于在簇的可压缩性和准确性之间保持良好的平衡。
让我们考虑两种情况:
Case 1: Treat the entire dataset as one cluster
Case 2: Treat each data point as a cluster
由于数据点与其对应的聚类中心之间的距离为零,这将提供最准确的聚类。但是,这无助于预测新的输入。它不会启用任何类型的数据汇总。
因此,我们可以得出结论,为任何数据集确定“正确”的集群数量非常重要。这是一项具有挑战性的任务,但如果我们依赖于数据分布的形状和比例,则非常容易上手。计算聚类数的一种简单方法是将“n”个点的数据集的值设置为大约√(n/2) 。在本文的其余部分,已经描述并在Python实现了两种方法,用于确定数据挖掘中的集群数量。
1.肘法:
该方法基于这样的观察,即增加集群数量有助于减少每个集群的集群内方差总和。拥有更多的集群允许提取更精细的彼此更相似的数据对象组。为了选择“正确”的簇数,使用簇内方差总和相对于簇数的曲线的转折点。曲线的第一个转折点表明对于任何 k > 0 的 'k' 的正确值。让我们在Python实现肘部方法。
第 1 步:导入库
Python3
# importing the libraries
import pandas as pd
import matplotlib.pyplot as plt
from sklearn.cluster import KMeans
Python3
# loading the dataset
dataset = pd.read_csv('Mall_Customers.csv')

# printing first five rows of the dataset
print(dataset.head(5))
Python3
# printing the shape of dataset
print(dataset.shape)

# checking for any
# null values present
print(dataset.isnull().sum())
Python3
# extracting values from two
# columns for clustering
dataset_new = dataset[['Annual Income (k$)',
                       'Spending Score (1-100)']].values
Python3
# determining the maximum number of clusters
# using the simple method
limit = int((dataset_new.shape[0]//2)**0.5)

# selecting optimal value of 'k'
# using elbow method

# wcss - within cluster sum of
# squared distances
wcss = {}

for k in range(2,limit+1):
    model = KMeans(n_clusters=k)
    model.fit(dataset_new)
    wcss[k] = model.inertia_

# plotting the wcss values
# to find out the elbow value
plt.plot(wcss.keys(), wcss.values(), 'gs-')
plt.xlabel('Values of "k"')
plt.ylabel('WCSS')
plt.show()
Python3
# importing the libraries
import pandas as pd
import numpy as np
import matplotlib.pyplot as plt
from sklearn.cluster import KMeans
from sklearn.metrics import silhouette_score
Python3
# loading the dataset
dataset = pd.read_csv('Mall_Customers.csv')

# printing first five rows of the dataset
print(dataset.head(5))
Python3
# printing the shape of dataset
print(dataset.shape)

# checking for any
# null values present
print(dataset.isnull().sum())
Python3
# extracting values from two
# columns for clustering
dataset_new = dataset[['Annual Income (k$)',
                       'Spending Score (1-100)']].values
Python3
# determining the maximum number of clusters
# using the simple method
limit = int((dataset_new.shape[0]//2)**0.5)

# determing number of clusters
# using silhouette score method
for k in range(2, limit+1):
    model = KMeans(n_clusters=k)
    model.fit(dataset_new)
    pred = model.predict(dataset_new)
    score = silhouette_score(dataset_new, pred)
    print('Silhouette Score for k = {}: {:<.3f}'.format(k, score))
Python3
# clustering the data using Kmeans
# using k = 5
model = KMeans(n_clusters=5)

# predicting the clusters
pred = model.fit_predict(dataset_new)

# plotting all the clusters
colours = ['red', 'blue', 'green', 'yellow', 'orange']

for i in np.unique(model.labels_):
    plt.scatter(dataset_new[pred==i, 0],
                dataset_new[pred==i, 1],
                c = colours[i])

# plotting the cluster centroids
plt.scatter(model.cluster_centers_[:, 0],
            model.cluster_centers_[:, 1],
            s = 200,  # marker size
            c = 'black')

plt.title('K Means clustering')
plt.xlabel('Annual Income (k$)')
plt.ylabel('Spending Score (1-100)')
plt.show()
第 2 步:加载数据集
我们使用了可在此链接上找到的 Mall Customer 数据集。
蟒蛇3
# loading the dataset
dataset = pd.read_csv('Mall_Customers.csv')

# printing first five rows of the dataset
print(dataset.head(5))
输出:
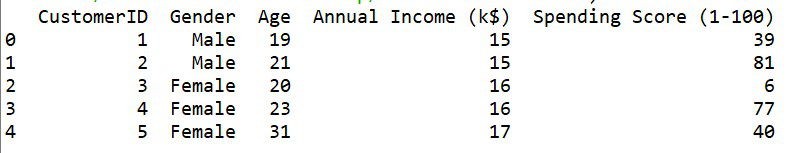
数据集的前五行
步骤 3:检查任何空值
数据集有 200 行和 5 列。它没有空值。
蟒蛇3
# printing the shape of dataset
print(dataset.shape)

# checking for any
# null values present
print(dataset.isnull().sum())
输出:

数据集的形状以及空值的计数
第 4 步:从数据集中提取 2 列进行聚类
让我们提取两列,即“年收入 (k$)”和“支出得分 (1-100)”以进行进一步处理。
蟒蛇3
# extracting values from two
# columns for clustering
dataset_new = dataset[['Annual Income (k$)',
                       'Spending Score (1-100)']].values
第 5 步:使用肘部方法确定聚类数并绘制图形
蟒蛇3
# determining the maximum number of clusters
# using the simple method
limit = int((dataset_new.shape[0]//2)**0.5)

# selecting optimal value of 'k'
# using elbow method

# wcss - within cluster sum of
# squared distances
wcss = {}

for k in range(2,limit+1):
    model = KMeans(n_clusters=k)
    model.fit(dataset_new)
    wcss[k] = model.inertia_

# plotting the wcss values
# to find out the elbow value
plt.plot(wcss.keys(), wcss.values(), 'gs-')
plt.xlabel('Values of "k"')
plt.ylabel('WCSS')
plt.show()
输出:
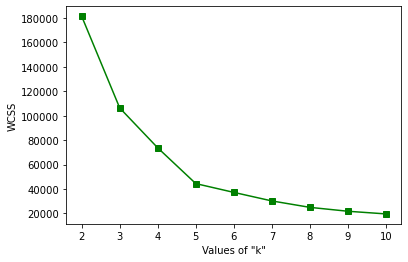
肘法图
通过上图,我们可以观察到这条曲线的转折点位于 k = 5 的值处。因此,我们可以说该数据的“正确”聚类数为 5。
2. 剪影分数:
轮廓分数用于评估使用聚类算法(例如 K-Means)创建的聚类的质量,这取决于数据点与其他彼此相似的数据点的聚类程度。此方法可用于找到 'k' 的最佳值。该分数在 [-1,1] 的范围内。轮廓分数接近 1 的“k”值可以被视为“正确”的簇数。 sklearn.metrics.silhouette _score()用于在Python查找分数。让我们为肘部方法中使用的相同数据集实现这一点。
步骤 1:导入库
蟒蛇3
# importing the libraries
import pandas as pd
import numpy as np
import matplotlib.pyplot as plt
from sklearn.cluster import KMeans
from sklearn.metrics import silhouette_score
第 2 步:加载数据集
我们使用了 Mall Customer 数据集。
蟒蛇3
# loading the dataset
dataset = pd.read_csv('Mall_Customers.csv')

# printing first five rows of the dataset
print(dataset.head(5))
输出:

数据集的前五行
步骤 3:检查任何空值
数据集有 200 行和 5 列。它没有空值。
蟒蛇3
# printing the shape of dataset
print(dataset.shape)

# checking for any
# null values present
print(dataset.isnull().sum())
输出:
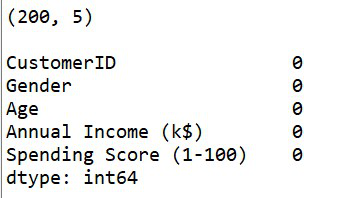
数据集的形状以及空值的计数
第 4 步:从数据集中提取 2 列进行聚类
让我们提取两列,即“年收入 (k$)”和“支出得分 (1-100)”以进行进一步处理。
蟒蛇3
# extracting values from two
# columns for clustering
dataset_new = dataset[['Annual Income (k$)',
                       'Spending Score (1-100)']].values
第 5 步:使用轮廓分数确定聚类数
计算轮廓分数所需的最小聚类数为 2。因此循环从 2 开始。
蟒蛇3
# determining the maximum number of clusters
# using the simple method
limit = int((dataset_new.shape[0]//2)**0.5)

# determing number of clusters
# using silhouette score method
for k in range(2, limit+1):
    model = KMeans(n_clusters=k)
    model.fit(dataset_new)
    pred = model.predict(dataset_new)
    score = silhouette_score(dataset_new, pred)
    print('Silhouette Score for k = {}: {:<.3f}'.format(k, score))
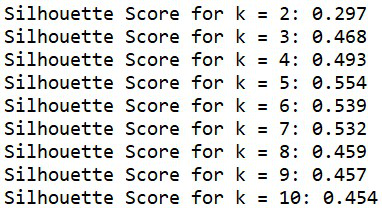
k = [2,..,10] 的轮廓分数
正如我们所观察到的,k = 5 的值具有最高值,即最接近 +1。因此,我们可以说 'k' 的最佳值为 5。
现在,我们已经使用两种方法——肘部方法和轮廓分数正确地确定并验证了购物中心客户数据集的集群数量。在这两种情况下,k = 5。现在让我们对数据集执行 KMeans 聚类并绘制聚类。
蟒蛇3
# clustering the data using Kmeans
# using k = 5
model = KMeans(n_clusters=5)

# predicting the clusters
pred = model.fit_predict(dataset_new)

# plotting all the clusters
colours = ['red', 'blue', 'green', 'yellow', 'orange']

for i in np.unique(model.labels_):
    plt.scatter(dataset_new[pred==i, 0],
                dataset_new[pred==i, 1],
                c = colours[i])

# plotting the cluster centroids
plt.scatter(model.cluster_centers_[:, 0],
            model.cluster_centers_[:, 1],
            s = 200,  # marker size
            c = 'black')

plt.title('K Means clustering')
plt.xlabel('Annual Income (k$)')
plt.ylabel('Spending Score (1-100)')
plt.show()
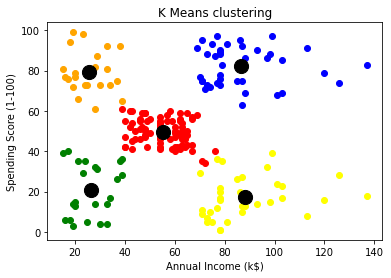
最终集群如此形成
从上图中,我们可以看到已经形成了五个有效的集群,它们显然彼此可分离。簇质心也以黑色可见。