使用 Matplotlib - Python绘制功率谱密度
matplotlib.pyplot.psd()函数用于绘制功率谱密度。在用于评估功率谱密度(例如,P xx )的 Welch 平均周期图方法中,矢量“x”被均分为 NFFT 段。每个段由函数窗口窗口化并由函数detrend 去趋势。段之间的重叠由“noverlap”给出。每段“i”的|fft(i)|*2 一起平均以计算 P,并使用缓冲缩放来校正由于开窗导致的功率损失。
注意:如果 len(x) < NFFT,则使用 NFFT 填充将为零。
Syntax: matplotlib.pyplot.psd(x, NFFT=None, Fs=None, Fc=None, detrend=None, window=None, noverlap=None, pad_to=None, sides=None, scale_by_freq=None, return_line=None, *, data=None, **kwargs)
Parameters:
- x: It is a required parameter of 1D array or a sequence containing data
- Fs: This is a required parameter that has a scalar value and has a default value of 2. Its value is the sampling frequency (samples per time unit). This value is used to calculate Fourier frequencies, freqs, in cycles per unit time.
- window: This is a callable N-D array which is generally a function or a vector of NFFT length. Its default value is window_hanning. When a function is passed as a parameter/argument, it takes a data segment as an argument and returns the windowed version of the segment
- sides: This parameter can have one of the three values namely ‘default’, ‘oneside’ or ‘twoside’. This is used for specifying which sides of the spectrum is to be returned. the ‘default’ gives its default behavior, which returns one-sided for real data and both for complex data. The ‘oneside’ value is used to force return a one-sided spectrum whereas the ‘twoside’ value is to return the two-sided spectrum.
- >pad_to: This parameter holds an integer value tat represents the number of points on which the data segment is padded while performing the FFT. It is important to note that this is different from NFFT, which sets the number of data points used. This can give more points on the plot without increasing the actual resolution of the spectrum (the minimum distance between the resolvable peaks) allowing for more detail. This also corresponds to ‘n’ parameter in the call of fft(). Its default value is None that sets the pad_to equal to NFFT.
- .NFFT: It holds an integer value representing the number of data points used in each block for FFT. The most efficient is the power of 2. Its default value is 256. Using this to get zero paddings must be avoided as it may result in incorrect scaling of the results, instead, pad_to is to be used for the same purpose.
- detrend: It can accept three values namely ‘none’, ‘mean’, ‘linear’ or a callable and has default value as ‘none’.This function is designed to remove the mean or linear trend before fft-ing of each segment. The detrend in Matplotlib is a function unlike the detrend in MATLAB where it is a vector. The ‘detrend_none’, ‘detrend_mean’ and ‘detrend_linear’ are defined by the mlab module, but one can use custom function too. Strings can also choose a function. The ‘none’ calls ‘detrend_none’, the ‘linear’ calls ‘detrend_linear’ and the ‘mean’ calls the ‘detrend_mean’.
- scale_by_freq: It is an optional argument that accepts a boolean value. It is used to specify whether the resulting density should be scaled by scaling the frequency. This would give the density in units of Hz^-1. This makes integration over the returned frequency values. The default for MATLAB compatibility is True.
- noverlap: It is an integer value that represents the total number of points that overlap between segments. The default value for this is 0 suggesting no overlap.
- Fc: It is an integer value representing the offsets of x extent of the plot to reflect the frequency range that is used when a signal is gained and then filtered after which it is downsampled to baseband. the ‘x’ represents the center frequency of x(default value of which is 0)
- return_line: It is a boolean that decides if to include the line objected that is plotted in the return values. This value is False by default
Returns:
- Pxx: It is a 1-D array which represents the the power spectrum P_{xx} before being scaled.
- freqs: It is a !-D array represents the corresponding frequencies to the Pxx elements
- line: It is a Line@D instance which is a line generated by the function. It only returns if return_line is set to True.
其他参数:
**kwargs关键字参数用于控制 Line2D 属性Property Description agg_filter a filter function that takes a (m, n, 3) float array and a dpi value that returns a (m, n, 3) array alpha float animated bool antialiased or aa bool clip_box Bbox clip_on bool clip_path [(Path, Transform)|Patch|None] color or c color contains callable dash_capstyle {‘butt’, ’round’, ‘projecting’} dash_joinstyle {‘miter’, ’round’, ‘bevel’} dashes sequence of floats(on/off ink in points) or (None, None) drawstyle or ds {‘default’, ‘steps’, ‘steps-pre’, ‘steps-mid’, ‘steps-post’}, default: ‘default’ figure figure fillstyle {‘full’, ‘left’, ‘right’, ‘bottom’, ‘top’, ‘none’} gid str in_layout bool label object linestyle or lsl {‘-‘, ‘–‘, ‘-.’, ‘:’, ”, (offset, on-off-seq), …} linewidth or lw float marker marker style markeredgecolor or mec color Cmarkeredgewidth or mew float markerfacecolor or mfc color markerfacecoloralt or mfcalt color markersize or ms float markevery None or int or (int, int) or slice or List[int] or float or (float, float) path_effects AbstractPathEffect picker float or callable[[Artist, Event], Tuple[bool, dict]] pickradius float rasterized bool or None sketch_params (scale: float, length: float, randomness: float)
snap bool or None solid_capstyle {‘butt’, ’round’, ‘projecting’}
solid_joinstyle {‘miter’, ’round’, ‘bevel’} transform matplotlib.transforms.Transform url str visible bool xdata 1D array ydata 1D array zorder float
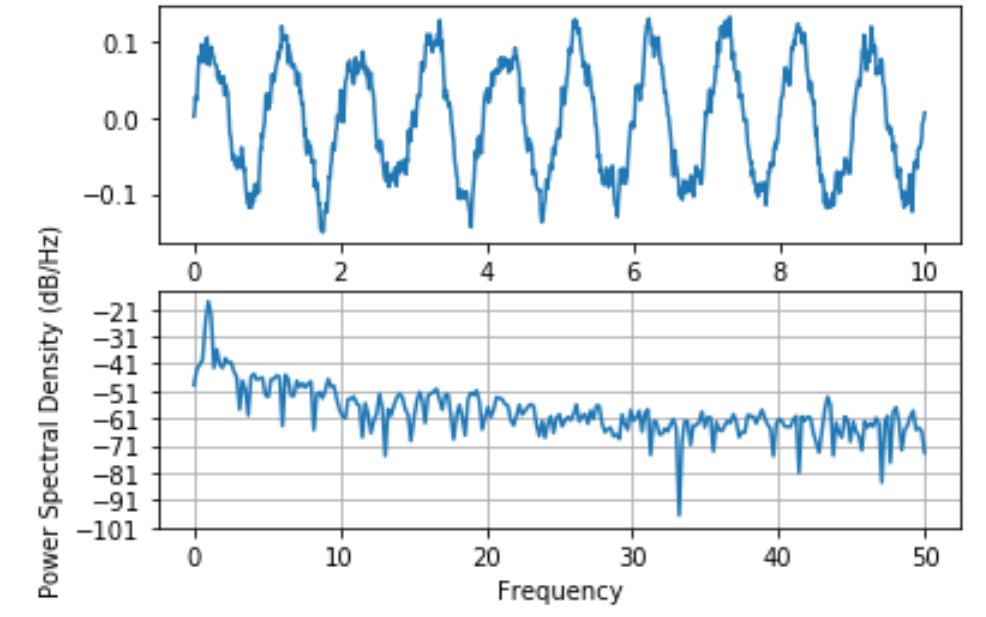
示例 1:
Python3
import matplotlib.pyplot as plt
import numpy as np
import matplotlib.mlab as mlab
import matplotlib.gridspec as gridspec

# set random state for reproducibility
np.random.seed(19695601)

diff = 0.01
ax = np.arange(0, 10, diff)
n = np.random.randn(len(ax))
by = np.exp(-ax / 0.05)

cn = np.convolve(n, by) * diff
cn = cn[:len(ax)]
s = 0.1 * np.sin(2 * np.pi * ax) + cn

plt.subplot(211)
plt.plot(ax, s)
plt.subplot(212)
plt.psd(s, 512, 1 / diff)

plt.show()
Python3
import matplotlib.pyplot as plt
import numpy as np
import matplotlib.mlab as mlab
import matplotlib.gridspec as gridspec


# set random valueto ensure reproducibility
random_rep = np.random.RandomState(19680801)

frame_per_second = 1000
a = np.linspace(0, 0.3, 301)
b = np.array([2, 8]).reshape(-1, 1)
c = np.array([150, 140]).reshape(-1, 1)
d = (b * np.exp(2j * np.pi * c * a)).sum(axis = 0) + 5 * random_rep.randn(*a.shape)

figure, (a0, a1) = plt.subplots(ncols = 2,
                                constrained_layout = True)

e = np.arange(-50, 30, 10)
f = (e[0], e[-1])
g = np.arange(-500, 550, 200)

a0.psd(d, NFFT = 301,
       Fs = frame_per_second,
       window = mlab.window_none,
       pad_to = 1024,
       scale_by_freq = True)

a0.set_title('Periodo-gram')
a0.set_yticks(e)
a0.set_xticks(g)
a0.grid(True)
a0.set_ylim(f)

a1.psd(d, NFFT = 150,
       Fs = frame_per_second,
       window = mlab.window_none,
       pad_to = 512,
       noverlap = 75,
       scale_by_freq = True)

a1.set_title('Welch')
a1.set_xticks(g)
a1.set_yticks(e)

# overwriting the y-label added by `psd`
a1.set_ylabel('')
a1.grid(True)
a1.set_ylim(f)

plt.show()
输出:
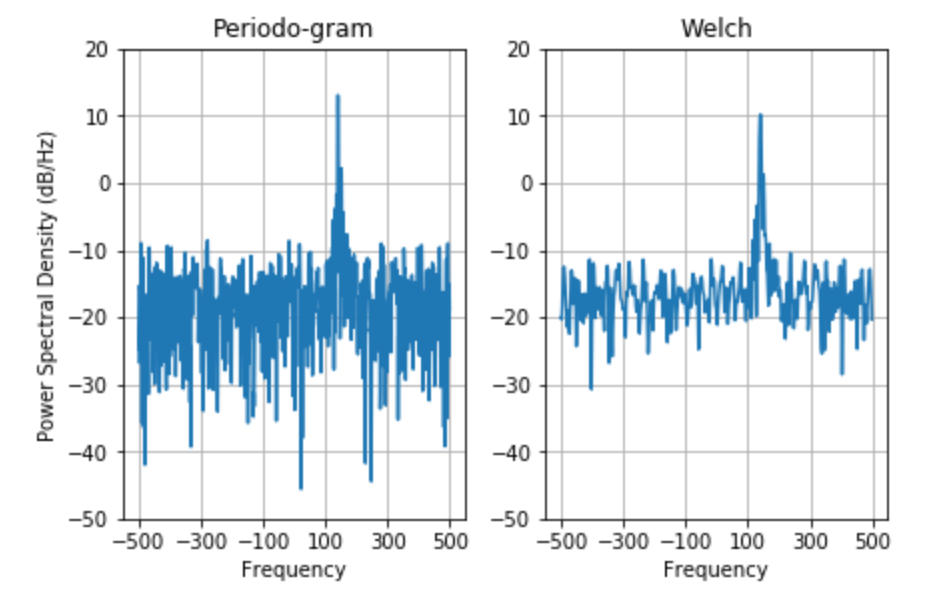
示例 2:
Python3
import matplotlib.pyplot as plt
import numpy as np
import matplotlib.mlab as mlab
import matplotlib.gridspec as gridspec


# set random valueto ensure reproducibility
random_rep = np.random.RandomState(19680801)

frame_per_second = 1000
a = np.linspace(0, 0.3, 301)
b = np.array([2, 8]).reshape(-1, 1)
c = np.array([150, 140]).reshape(-1, 1)
d = (b * np.exp(2j * np.pi * c * a)).sum(axis = 0) + 5 * random_rep.randn(*a.shape)

figure, (a0, a1) = plt.subplots(ncols = 2,
                                constrained_layout = True)

e = np.arange(-50, 30, 10)
f = (e[0], e[-1])
g = np.arange(-500, 550, 200)

a0.psd(d, NFFT = 301,
       Fs = frame_per_second,
       window = mlab.window_none,
       pad_to = 1024,
       scale_by_freq = True)

a0.set_title('Periodo-gram')
a0.set_yticks(e)
a0.set_xticks(g)
a0.grid(True)
a0.set_ylim(f)

a1.psd(d, NFFT = 150,
       Fs = frame_per_second,
       window = mlab.window_none,
       pad_to = 512,
       noverlap = 75,
       scale_by_freq = True)

a1.set_title('Welch')
a1.set_xticks(g)
a1.set_yticks(e)

# overwriting the y-label added by `psd`
a1.set_ylabel('')
a1.grid(True)
a1.set_ylim(f)

plt.show()
输出: