Python中 Pandas 的密度图
密度图是一种数据可视化工具。它是直方图的一种变体,在绘制值时使用“核平滑”。它是从数据推断出的直方图的连续平滑版本。
密度图使用核密度估计(因此它们也称为核密度估计图或 KDE),这是一种概率密度函数。具有较高峰值的绘图区域是最大数据点位于这些值之间的区域。
可以使用 pandas、seaborn 等制作密度图。在本文中,我们将使用 Pandas 生成密度图。我们将使用 Seaborn 库的两个数据集,即“car_crashes”和“tips”。
Syntax: pandas.DataFrame.plot.density | pandas.DataFrame.plot.kde
where pandas -> the dataset of the type ‘pandas dataframe’
Dataframe -> the column for which the density plot is to be drawn
plot -> keyword directing to draw a plot/graph for the given column
density -> for plotting a density graph
kde -> to plot a density graph using the Kernel Density Estimation function
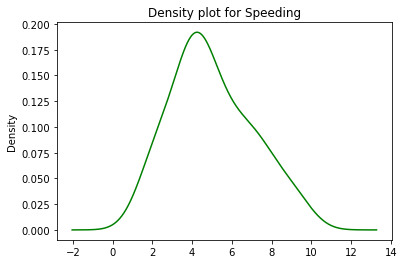
示例 1:给定数据集“car_crashes”,让我们使用密度图找出大多数车祸发生的最常见速度。
Python3
# importing the libraries
import pandas as pd
import seaborn as sns
import matplotlib.pyplot as plt

# loading the dataset
# from seaborn library
data = sns.load_dataset('car_crashes')

# viewing the dataset
print(data.head(4))
Python3
# plotting the density plot
# for 'speeding' attribute
# using plot.density()
data.speeding.plot.density(color='green')
plt.title('Density plot for Speeding')
plt.show()
Python3
# loading the dataset
# from seaborn library
data = sns.load_dataset('tips')

# viewing the dataset
print(data.head(4))
Python3
# density plot for 'tip'
data.tip.plot.density(color='green')
plt.title('Density Plot for Tip')
plt.show()
Python3
# for 'tip' attribute
# using plot.kde()
data.tip.plot.kde(color='green')
plt.title('KDE-Density plot for Tip')
plt.show()
输出:

绘制图形:
蟒蛇3
# plotting the density plot
# for 'speeding' attribute
# using plot.density()
data.speeding.plot.density(color='green')
plt.title('Density plot for Speeding')
plt.show()
输出:

使用密度图,我们可以计算出 4-5 (kmph) 之间的速度是数据集中最常见的碰撞事故,因为它是高密度(高峰)区域。
示例 2:对于另一个数据集“tips”,让我们计算一下客户给出的最常见的提示是什么。
蟒蛇3
# loading the dataset
# from seaborn library
data = sns.load_dataset('tips')

# viewing the dataset
print(data.head(4))
输出:

“提示”数据集
绘制图形:
蟒蛇3
# density plot for 'tip'
data.tip.plot.density(color='green')
plt.title('Density Plot for Tip')
plt.show()

通过上面的密度图,我们可以推断出最常见的尖端在 2.5 – 3 的范围内。发现最高峰值/密度(如 y 轴所示)位于尖端值 2.5 – 3。
使用 plot.kde() 绘制上面的图
KDE 或 Kernel Density Estimation 使用高斯核来估计随机变量的概率密度函数。下面是使用 kde() 为数据集“tips”绘制密度图的实现。
蟒蛇3
# for 'tip' attribute
# using plot.kde()
data.tip.plot.kde(color='green')
plt.title('KDE-Density plot for Tip')
plt.show()

使用它我们可以推断出 plot.density() 和 plot.kde() 之间没有主要区别,因此可以互换使用。
密度图优于直方图,因为它们比直方图更有效地确定分布的形状。与直方图中不同,它们不必依赖于使用的 bin 数量。