使用 Matplotlib 在Python中绘制箱线图
箱线图也称为晶须图,用于显示具有最小值、第一四分位数、中位数、第三四分位数和最大值等属性的数据值集的摘要。在箱线图中,从第一个四分位数到第三个四分位数创建了一个框,还有一条垂直线穿过中位数的框。这里 x 轴表示要绘制的数据,而 y 轴表示频率分布。
创建箱线图
matplotlib 库的 matplotlib.pyplot 模块提供了 boxplot()函数,借助该函数我们可以创建箱线图。
句法:
matplotlib.pyplot.boxplot(data, notch=None, vert=None, patch_artist=None, widths=None)
参数:
| Attribute | Value |
|---|---|
| data | array or sequence of array to be plotted |
| notch | optional parameter accepts boolean values |
| vert | optional parameter accepts boolean values false and true for horizontal and vertical plot respectively |
| bootstrap | optional parameter accepts int specifies intervals around notched boxplots |
| usermedians | optional parameter accepts array or sequence of array dimension compatible with data |
| positions | optional parameter accepts array and sets the position of boxes |
| widths | optional parameter accepts array and sets the width of boxes |
| patch_artist | optional parameter having boolean values |
| labels | sequence of strings sets label for each dataset |
| meanline | optional having boolean value try to render meanline as full width of box |
| order | optional parameter sets the order of the boxplot |
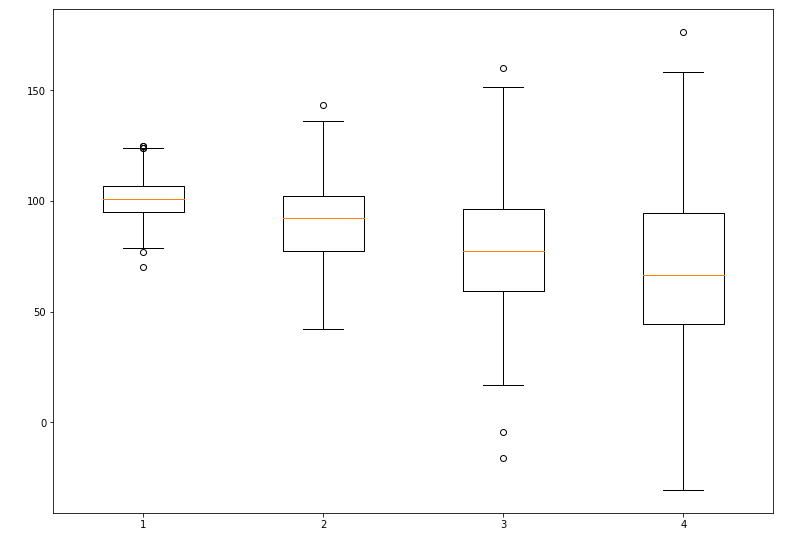
赋予 ax.boxplot() 方法的数据值可以是 Numpy 数组或Python列表或数组元组。让我们通过使用 numpy.random.normal() 创建一些随机数据来创建箱线图,它将均值、标准差和所需的值数量作为参数。
例子:
Python3
# Import libraries
import matplotlib.pyplot as plt
import numpy as np


# Creating dataset
np.random.seed(10)
data = np.random.normal(100, 20, 200)

fig = plt.figure(figsize =(10, 7))

# Creating plot
plt.boxplot(data)

# show plot
plt.show()
Python3
# Import libraries
import matplotlib.pyplot as plt
import numpy as np


# Creating dataset
np.random.seed(10)

data_1 = np.random.normal(100, 10, 200)
data_2 = np.random.normal(90, 20, 200)
data_3 = np.random.normal(80, 30, 200)
data_4 = np.random.normal(70, 40, 200)
data = [data_1, data_2, data_3, data_4]

fig = plt.figure(figsize =(10, 7))

# Creating axes instance
ax = fig.add_axes([0, 0, 1, 1])

# Creating plot
bp = ax.boxplot(data)

# show plot
plt.show()
Python3
# Import libraries
import matplotlib.pyplot as plt
import numpy as np
# Creating dataset
np.random.seed(10)
data_1 = np.random.normal(100, 10, 200)
data_2 = np.random.normal(90, 20, 200)
data_3 = np.random.normal(80, 30, 200)
data_4 = np.random.normal(70, 40, 200)
data = [data_1, data_2, data_3, data_4]
fig = plt.figure(figsize =(10, 7))
ax = fig.add_subplot(111)
# Creating axes instance
bp = ax.boxplot(data, patch_artist = True,
notch ='True', vert = 0)
colors = ['#0000FF', '#00FF00',
'#FFFF00', '#FF00FF']
for patch, color in zip(bp['boxes'], colors):
patch.set_facecolor(color)
# changing color and linewidth of
# whiskers
for whisker in bp['whiskers']:
whisker.set(color ='#8B008B',
linewidth = 1.5,
linestyle =":")
# changing color and linewidth of
# caps
for cap in bp['caps']:
cap.set(color ='#8B008B',
linewidth = 2)
# changing color and linewidth of
# medians
for median in bp['medians']:
median.set(color ='red',
linewidth = 3)
# changing style of fliers
for flier in bp['fliers']:
flier.set(marker ='D',
color ='#e7298a',
alpha = 0.5)
# x-axis labels
ax.set_yticklabels(['data_1', 'data_2',
'data_3', 'data_4'])
# Adding title
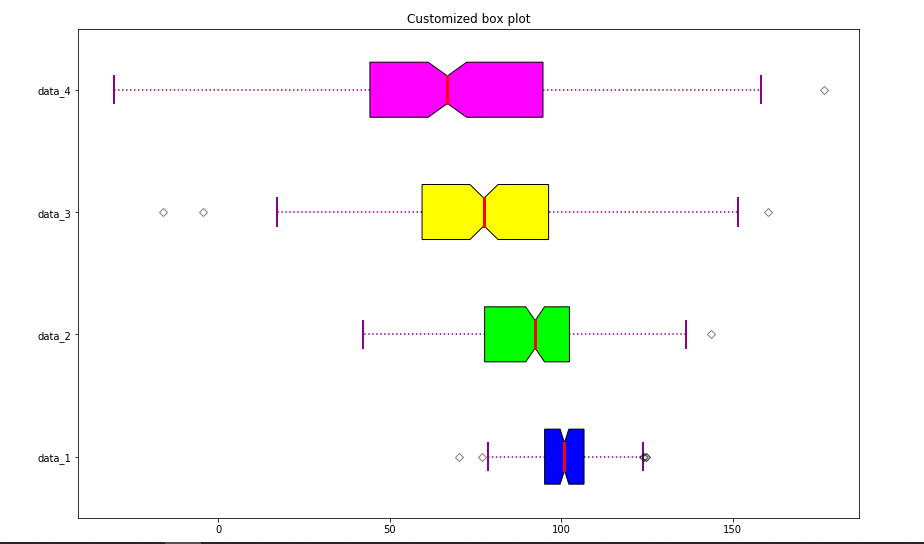
plt.title("Customized box plot")
# Removing top axes and right axes
# ticks
ax.get_xaxis().tick_bottom()
ax.get_yaxis().tick_left()
# show plot
plt.show()输出:

自定义箱线图
matplotlib.pyplot.boxplot() 为箱线图提供了无限的定制可能性。 notch = True 属性为箱线图创建缺口格式,patch_artist = True 用颜色填充箱线图,我们可以为不同的箱设置不同的颜色。vert = 0 属性创建水平箱线图。标签采用与数字数据集相同的维度。
示例 1:
Python3
# Import libraries
import matplotlib.pyplot as plt
import numpy as np


# Creating dataset
np.random.seed(10)

data_1 = np.random.normal(100, 10, 200)
data_2 = np.random.normal(90, 20, 200)
data_3 = np.random.normal(80, 30, 200)
data_4 = np.random.normal(70, 40, 200)
data = [data_1, data_2, data_3, data_4]

fig = plt.figure(figsize =(10, 7))

# Creating axes instance
ax = fig.add_axes([0, 0, 1, 1])

# Creating plot
bp = ax.boxplot(data)

# show plot
plt.show()
输出:
示例 2:让我们尝试使用一些自定义项来修改上面的图:
Python3
# Import libraries
import matplotlib.pyplot as plt
import numpy as np

# Creating dataset
np.random.seed(10)
data_1 = np.random.normal(100, 10, 200)
data_2 = np.random.normal(90, 20, 200)
data_3 = np.random.normal(80, 30, 200)
data_4 = np.random.normal(70, 40, 200)
data = [data_1, data_2, data_3, data_4]

fig = plt.figure(figsize =(10, 7))
ax = fig.add_subplot(111)

# Creating axes instance
bp = ax.boxplot(data, patch_artist = True,
                notch ='True', vert = 0)

colors = ['#0000FF', '#00FF00',
          '#FFFF00', '#FF00FF']

for patch, color in zip(bp['boxes'], colors):
    patch.set_facecolor(color)

# changing color and linewidth of
# whiskers
for whisker in bp['whiskers']:
    whisker.set(color ='#8B008B',
                linewidth = 1.5,
                linestyle =":")

# changing color and linewidth of
# caps
for cap in bp['caps']:
    cap.set(color ='#8B008B',
            linewidth = 2)

# changing color and linewidth of
# medians
for median in bp['medians']:
    median.set(color ='red',
               linewidth = 3)

# changing style of fliers
for flier in bp['fliers']:
    flier.set(marker ='D',
              color ='#e7298a',
              alpha = 0.5)

# x-axis labels
ax.set_yticklabels(['data_1', 'data_2',
                    'data_3', 'data_4'])

# Adding title
plt.title("Customized box plot")

# Removing top axes and right axes
# ticks
ax.get_xaxis().tick_bottom()
ax.get_yaxis().tick_left()

# show plot
plt.show()
输出: