如何在 R 中创建水平箱线图?
在本文中,我们将讨论如何在 R 编程语言中创建水平箱线图。
方法 1:在基础 R 中创建水平箱线图
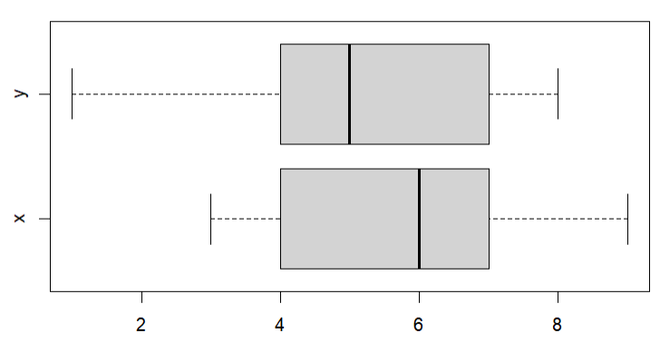
在此创建水平条形图的方法中,用户只需调用 R 语言的基本函数boxplot()函数,然后用户需要调用该函数的水平参数并将其初始化为真值以水平方式获得箱线图。
boxplot()函数:此函数用于生成给定值的盒须图。
Syntax: boxplot(formula, data = NULL, …, horizontal = TRUE)
Parameters:
- formula: a formula, such as y ~ grp, where y is a numeric vector of data values to be split into groups according to the grouping variable grp.
- data: a data.frame (or list) from which the variables in the formula should be taken.
- horizontal: logical indicating if the boxplots should be horizontal.
- … : Other parameters
示例:在此示例中,我们使用带有 2 个变量的数据框来创建给定变量的水平箱线图,使用带有水平参数的箱线图在 R 编程语言中。
R
# Create DataFrame
gfg<-data.frame(x=c(6,8,9,6,4,7,6,3,4),
                y=c(4,6,8,7,8,4,5,1,3))

# Create Horizontal Boxplot
boxplot(gfg,horizontal=TRUE)
R
# Import ggplot2 package
library(ggplot2)

# Create Data
gfg<-data.frame(x=c(6,8,9,6,4,7,6,3,4,9,6,3),
                grp=rep(c('A','B','C','D'),
                        each=3))

# Create horizontal boxplot
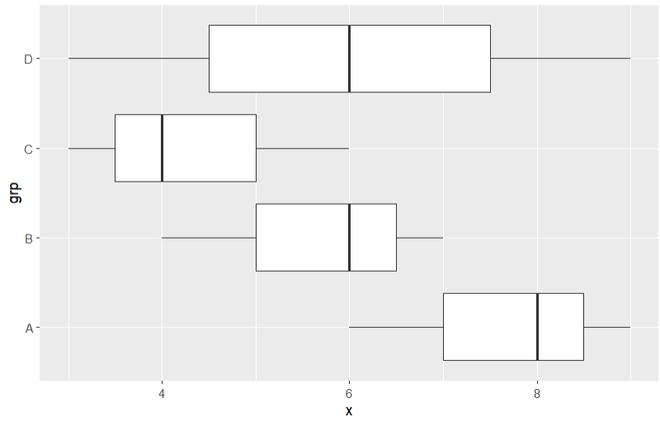
ggplot(gfg,aes(x=grp,y=x)) +geom_boxplot() + coord_flip()
输出:
方法 2:使用 coord_flip() 创建水平箱线图
在这种在 ggplot2 中创建水平箱线图的方法中,用户需要在工作的 R 控制台中安装和导入 ggplot2 包,这里 ggplot2 包负责绘制箱线图并提供包的其他功能。然后用户只需调用 geom_boxplot()函数,该函数将简单地以给定数据的垂直方式绘制箱线图,并且用户还需要调用 coord_flip() 来翻转轴和最终箱线图将导致 R 编程语言中的水平箱线图。
在 R 语言中导入和安装 ggplot2 包的语法:
install.package("ggplot2")
library("ggplot2")coord_flip()函数:该函数用于翻转笛卡尔坐标,使水平变为垂直,垂直变为水平。
Syntax: coord_flip(…)
Parameters:
- …: Other arguments passed
示例:在此示例中,我们将使用 ggplot2 包中的 geom_boxplot()函数和 coord_flip()函数在 R 编程语言中绘制给定数据的水平箱线图。
R
# Import ggplot2 package
library(ggplot2)

# Create Data
gfg<-data.frame(x=c(6,8,9,6,4,7,6,3,4,9,6,3),
                grp=rep(c('A','B','C','D'),
                        each=3))

# Create horizontal boxplot
ggplot(gfg,aes(x=grp,y=x)) +geom_boxplot() + coord_flip()
输出:

