在 R 中显示条形图的所有 X 轴标签
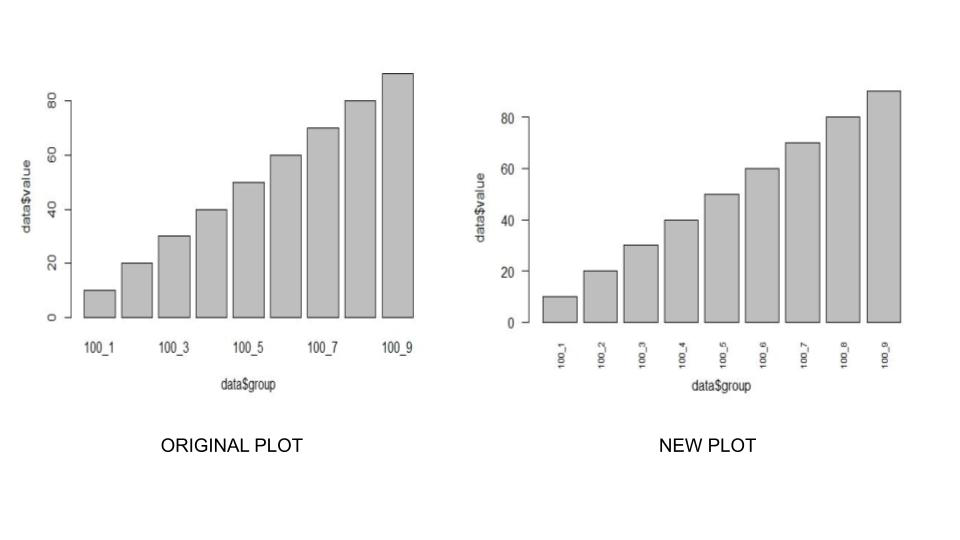
在处理条形图时,可能会出现 X 轴上的所有标签可能由于变量名称的长度而不可见的情况。本文涉及解决 R 编程语言中的问题。
方法 1:使用 barplot()
在 R 语言中 barplot()函数用于创建条形图。它将 x 和 y 轴作为所需参数并绘制条形图。要显示所有标签,我们需要旋转轴,我们使用las参数来完成。为了垂直于轴旋转标签,我们将 las 的值设置为2 ,对于水平旋转,我们将值设置为1 。其次,为了增加标签的字体大小,我们使用cex.names来设置标签的字体大小。
Syntax: barplot(data, xlab, ylab)
Parameter:
data is the data vector to be represented on y-axis
xlab is the label given to x-axis
ylab is the label given to y-axis
例子:
R
rm(list = ls())

# Create the data
data <- data.frame(value = c(10,20,30,40,50,60,70,80,90),
                   group = paste0("100_", 1:9))

# Original plot
barplot(data$value ~ data$group)

# Modify x-axis labels
barplot(data$value ~ data$group,
        las = 2,
        cex.names = 1)
R
rm(list = ls())

# import library
library("ggplot2")

# Create the data
data <- data.frame(value = c(90,80,70,60,50,40,30,20,10),
                   UID = paste0("10012210_", 1:9))
head(data)

# creating a bot plot
ggplot(data, aes(UID, value)) +
  geom_bar(stat = "identity")


# ggplot2 plot with modified x-axis labels
ggplot(data, aes(UID, value)) +
  geom_bar(stat = "identity") +
  theme(axis.text.x = element_text(angle = 90, size = 10))
输出:

方法二:使用ggplot
另一个最流行的 R 绘图库是 ggplot2。我们使用 ggplot2 中的 geom_bar() 函数绘制箱线图。要指定对 x 轴的更改,我们在中使用axis.text.x参数 theme()函数并使用element_text()指定角度和字体大小。
例子:
电阻
rm(list = ls())

# import library
library("ggplot2")

# Create the data
data <- data.frame(value = c(90,80,70,60,50,40,30,20,10),
                   UID = paste0("10012210_", 1:9))
head(data)

# creating a bot plot
ggplot(data, aes(UID, value)) +
  geom_bar(stat = "identity")


# ggplot2 plot with modified x-axis labels
ggplot(data, aes(UID, value)) +
  geom_bar(stat = "identity") +
  theme(axis.text.x = element_text(angle = 90, size = 10))
输出:
