Python Plotly 中内置的连续色标
Plotly 具有内置的离散和连续色标。此条目介绍的是离散色标。几个 Plotly Express 函数接受颜色连续比例输入,并且许多跟踪类型在其模式中具有颜色比例属性。 Plotly 有多种内置的连续色标,可以在Python代码中通过名称或引用指定参数时引用。
打印出色标名称的代码:
Python3
#import packages
import plotly.express as px

plotly_colorscales = px.colors.named_colorscales()

# printing color scales
print(plotly_colorscales)
Python3
# importing packages
import plotly.express as px

fig = px.colors.sequential.swatches_continuous()
fig.show()
Python3
# import packages and libraries
import pandas as pd
from matplotlib import pyplot as plt
import numpy as np
import plotly.express as px

# reading the dataset
df = pd.read_csv('weather.csv', encoding='UTF-8')

# plot a scatterplot
fig = px.scatter(df, x="Temperature", y='Humidity', color='Light',
                 title="Numeric 'size' values represents continuous color")


fig.show()
Python3
# import packages and libraries
import pandas as pd
from matplotlib import pyplot as plt
import numpy as np
import plotly.express as px

# reading the dataset
df = pd.read_csv('weather.csv', encoding='UTF-8')

# creating a scatterplot
fig = px.scatter(df, x="Temperature", y='Humidity', color='Light',
                 color_continuous_scale=px.colors.sequential.Rainbow)


fig.show()
Python3
# import packages and libraries
import pandas as pd
from matplotlib import pyplot as plt
import numpy as np
import plotly.express as px

# reading the dataset
df = pd.read_csv('weather.csv', encoding='UTF-8')

# creating a scatterplot
fig = px.scatter(df, x="Temperature", y='Humidity', color='Light',
                 color_continuous_scale='Viridis')


fig.show()
输出:
[‘aggrnyl’, ‘agsunset’, ‘blackbody’, ‘bluered’, ‘blues’, ‘blugrn’, ‘bluyl’, ‘brwnyl’, ‘bugn’, ‘bupu’,’burg’, ‘burgyl’, ‘cividis’, ‘darkmint’, ‘electric’, ’emrld’, ‘gnbu’, ‘greens’, ‘greys’, ‘hot’, ‘inferno’,’jet’, ‘magenta’, ‘magma’, ‘mint’, ‘orrd’, ‘oranges’, ‘oryel’, ‘peach’, ‘pinkyl’, ‘plasma’, ‘plotly3′,’pubu’, ‘pubugn’, ‘purd’, ‘purp’, ‘purples’, ‘purpor’, ‘rainbow’, ‘rdbu’, ‘rdpu’, ‘redor’, ‘reds’,’sunset’, ‘sunsetdark’, ‘teal’, ‘tealgrn’, ‘turbo’, ‘viridis’, ‘ylgn’, ‘ylgnbu’, ‘ylorbr’, ‘ylorrd’,’algae’, ‘amp’, ‘deep’, ‘dense’, ‘gray’, ‘haline’, ‘ice’, ‘matter’, ‘solar’, ‘speed’, ‘tempo’, ‘thermal’,’turbid’, ‘armyrose’, ‘brbg’, ‘earth’, ‘fall’, ‘geyser’, ‘prgn’, ‘piyg’, ‘picnic’, ‘portland’, ‘puor’,’rdgy’, ‘rdylbu’, ‘rdylgn’, ‘spectral’, ‘tealrose’, ‘temps’, ‘tropic’, ‘balance’, ‘curl’, ‘delta’, ‘oxy’, ‘edge’, ‘hsv’, ‘icefire’, ‘phase’, ‘twilight’, ‘mrybm’, ‘mygbm’]
在 plotly.colors.sequential 模块中查看内置顺序色标的代码。 Swatches_sequential() 方法用于查看色标。该方法返回所有连续色标的图:
Python3
# importing packages
import plotly.express as px

fig = px.colors.sequential.swatches_continuous()
fig.show()
输出:

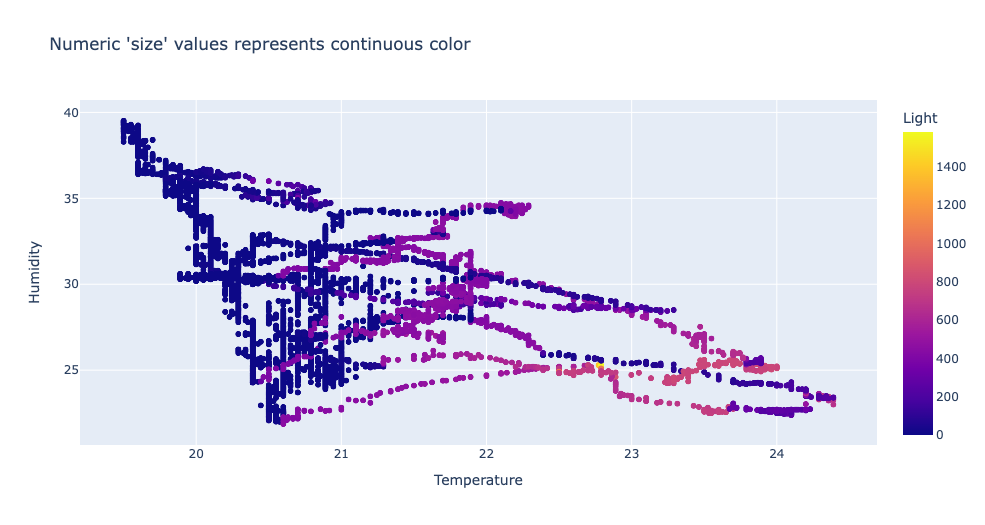
示例 1:
绘制散点图,其中散点图的颜色取决于“光”列。 'size' 值代表连续的颜色。
要查看和下载示例中使用的 CSV 文件,请单击此处。
Python3
# import packages and libraries
import pandas as pd
from matplotlib import pyplot as plt
import numpy as np
import plotly.express as px

# reading the dataset
df = pd.read_csv('weather.csv', encoding='UTF-8')

# plot a scatterplot
fig = px.scatter(df, x="Temperature", y='Humidity', color='Light',
                 title="Numeric 'size' values represents continuous color")


fig.show()
输出:

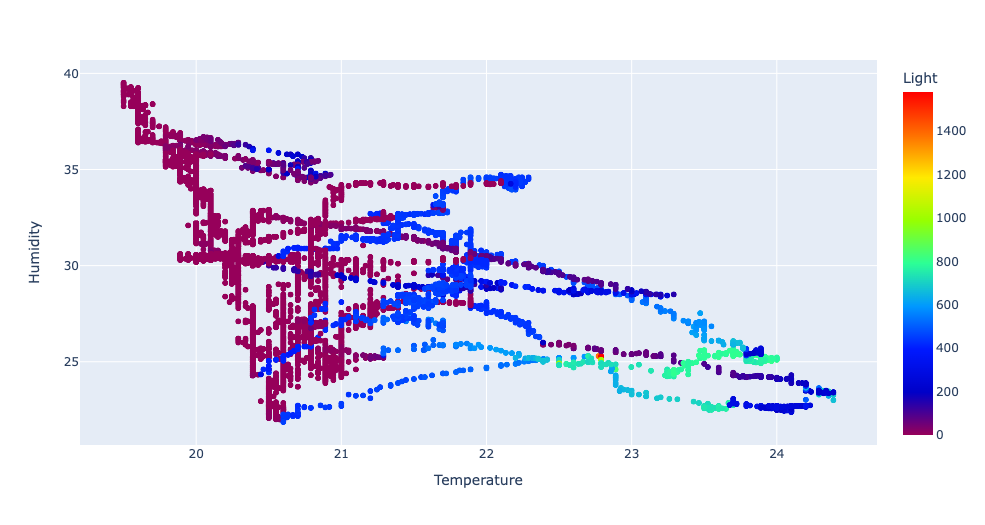
示例 2:
再次重复相同的示例,但在 px 中。 scatter() 方法我们包含一个额外的参数“color_continous_scale”,颜色比例的名称作为输入给出。 px.colors.sequential 包含色标。在给定的示例中,彩虹是色标的名称。
Python3
# import packages and libraries
import pandas as pd
from matplotlib import pyplot as plt
import numpy as np
import plotly.express as px

# reading the dataset
df = pd.read_csv('weather.csv', encoding='UTF-8')

# creating a scatterplot
fig = px.scatter(df, x="Temperature", y='Humidity', color='Light',
                 color_continuous_scale=px.colors.sequential.Rainbow)


fig.show()
输出:

示例 3:
我们还可以通过将连续色标的名称作为字符串来指定色标的名称。 'Viridis' 是色标的名称。
Python3
# import packages and libraries
import pandas as pd
from matplotlib import pyplot as plt
import numpy as np
import plotly.express as px

# reading the dataset
df = pd.read_csv('weather.csv', encoding='UTF-8')

# creating a scatterplot
fig = px.scatter(df, x="Temperature", y='Humidity', color='Light',
                 color_continuous_scale='Viridis')


fig.show()
输出:
