印度的 Corona Virus 实时更新 – 使用Python
众所周知,全世界都受到 COVID-19 大流行的影响,几乎每个人都在家工作。我们都应该充其量利用这段时间来提高我们的技术技能或编写一些好的 Pythonic 脚本。
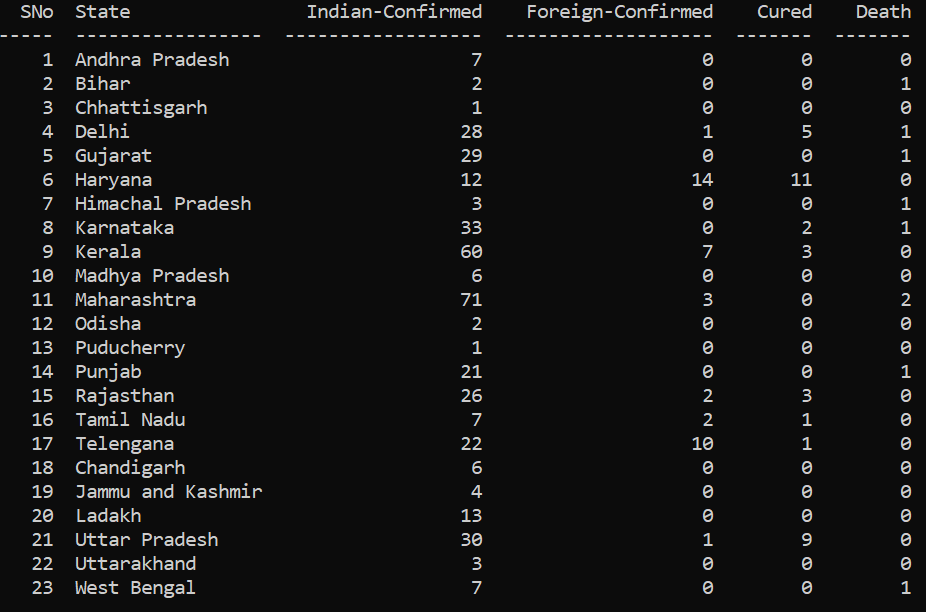
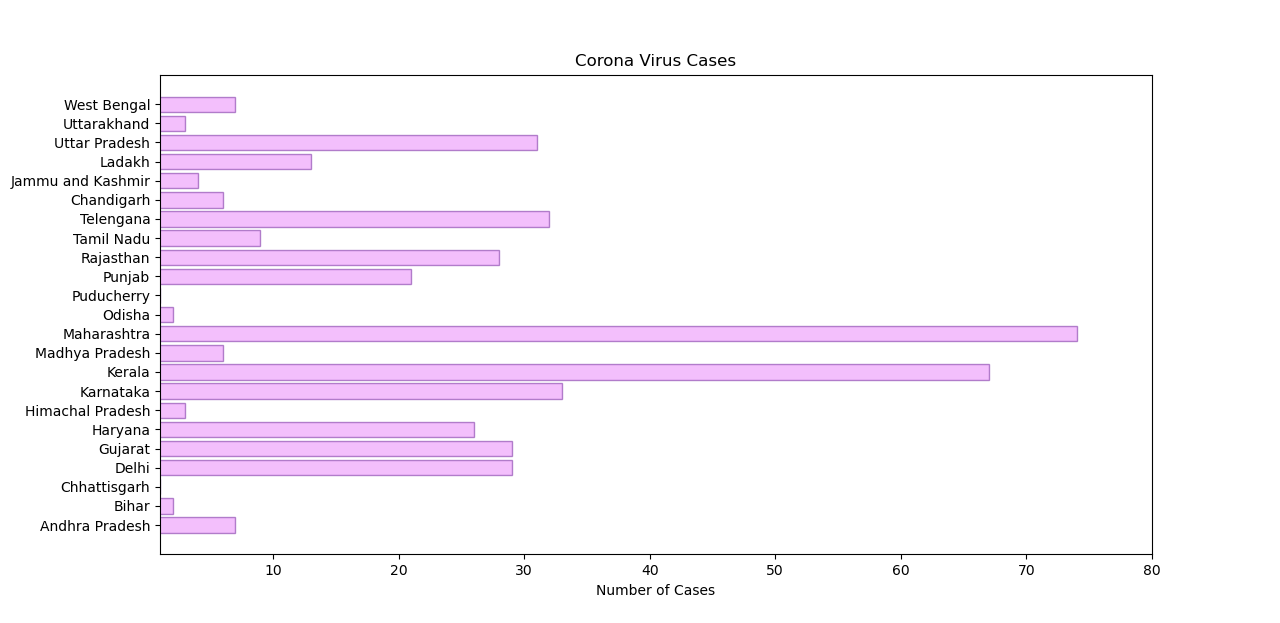
让我们看一个简单的Python脚本来演示印度各州的冠状病毒病例。此Python脚本从卫生部官方网站获取实时数据。然后数据在水平条形图中表示。
要运行此脚本,请按照以下安装 -
$ pip install bs4
$ pip install tabulate
$ pip install matplotlib
$ pip install numpy
$ pip install requests
让我们尝试一步一步地执行脚本。
第1步:
Python3
# importing libraries

import requests
from bs4 import BeautifulSoup
from tabulate import tabulate
import os
import numpy as np
import matplotlib.pyplot as plt
Python3
extract_contents = lambda row: [x.text.replace('\n', '') for x in row]
URL = 'https://www.mohfw.gov.in/'

SHORT_HEADERS = ['SNo', 'State','Indian-Confirmed(Including Foreign Confirmed)','Cured','Death']

response = requests.get(URL).content
soup = BeautifulSoup(response, 'html.parser')
header = extract_contents(soup.tr.find_all('th'))

stats = []
all_rows = soup.find_all('tr')

for row in all_rows:
    stat = extract_contents(row.find_all('td'))

    if stat:
        if len(stat) == 4:
            # last row
            stat = ['', *stat]
            stats.append(stat)
        elif len(stat) == 5:
            stats.append(stat)

stats[-1][0] = len(stats)
stats[-1][1] = "Total Cases"
Python3
objects = []
for row in stats :
    objects.append(row[1])

y_pos = np.arange(len(objects))

performance = []
for row in stats[:len(stats)-1] :
    performance.append(int(row[2]))

performance.append(int(stats[-1][2][:len(stats[-1][2])-1]))

table = tabulate(stats, headers=SHORT_HEADERS)
print(table)
Python3
plt.barh(y_pos, performance, align='center', alpha=0.5,
                 color=(234/256.0, 128/256.0, 252/256.0),
                 edgecolor=(106/256.0, 27/256.0, 154/256.0))

plt.yticks(y_pos, objects)
plt.xlim(1,performance[-1]+1000)
plt.xlabel('Number of Cases')
plt.title('Corona Virus Cases')
plt.show()
第2步:
Python3
extract_contents = lambda row: [x.text.replace('\n', '') for x in row]
URL = 'https://www.mohfw.gov.in/'

SHORT_HEADERS = ['SNo', 'State','Indian-Confirmed(Including Foreign Confirmed)','Cured','Death']

response = requests.get(URL).content
soup = BeautifulSoup(response, 'html.parser')
header = extract_contents(soup.tr.find_all('th'))

stats = []
all_rows = soup.find_all('tr')

for row in all_rows:
    stat = extract_contents(row.find_all('td'))

    if stat:
        if len(stat) == 4:
            # last row
            stat = ['', *stat]
            stats.append(stat)
        elif len(stat) == 5:
            stats.append(stat)

stats[-1][0] = len(stats)
stats[-1][1] = "Total Cases"
第 3 步:
Python3
objects = []
for row in stats :
    objects.append(row[1])

y_pos = np.arange(len(objects))

performance = []
for row in stats[:len(stats)-1] :
    performance.append(int(row[2]))

performance.append(int(stats[-1][2][:len(stats[-1][2])-1]))

table = tabulate(stats, headers=SHORT_HEADERS)
print(table)
输出:

第4步:
Python3
plt.barh(y_pos, performance, align='center', alpha=0.5,
                 color=(234/256.0, 128/256.0, 252/256.0),
                 edgecolor=(106/256.0, 27/256.0, 154/256.0))

plt.yticks(y_pos, objects)
plt.xlim(1,performance[-1]+1000)
plt.xlabel('Number of Cases')
plt.title('Corona Virus Cases')
plt.show()
输出:
