在 Jupyter Notebook 中制作 3D 交互式 Matplotlib 绘图
Matplotlib 是一个数据可视化库。如果不将数据可视化,就很难分析/深入了解数据。 matplotlib 是一个很棒的库,用于在Python对数据进行可视化分析。使用 matplotlib,我们可以绘制 1-D、2-D 甚至 3-D 数据。在本文中,我们将学习如何使用 matplotlib 绘制各种 3-D 图。要在Python绘制 3-D 图,我们需要从Python的 matplotlib 库的标准安装中导入mplot3d库。
由于 matplotlib 是第三方库,它没有标准安装Python,所以你需要在阅读本文之前安装 matplotlib。以下是您可以安装 matplotlib 库的命令。
句法:
pip3 install matplotlib
要使绘图具有交互性,您需要做的就是安装另一个名为ipympl 的库,即交互式Python matplotlib。
句法:
pip3 install ipympl
使用Axes3D.plot()函数创建 3d 图形。
Syntax:
Axes3D.plot(xs, ys, zs,*args, **kwargs)
Parameter:
- xs: the x coordinate value of the vertices.
- ys: the y coordinate values of the vertices.
- zs: The z coordinate value(s), either one for all points or one for each point.
要生成交互式 3D 绘图,首先导入必要的包并创建一个随机数据集。现在使用 mplot3d 库中的 Axes3D(figure)函数,我们可以直接生成所需的绘图。将数据传递到 3D 绘图并配置标题和标签。
注意:我们必须添加“%matplotlib 小部件”,它是一个 Jupyter 魔术小部件,用于告诉 jupyter 使用交互式后端进行绘图。我们必须将它添加到脚本的顶部以在ipython notebook(即 Jupyter notebook、Google Colab、Kaggle Kernel 等)中创建交互式绘图,以将图形渲染为交互式图形。
下面给出了一些实现相同的实现。
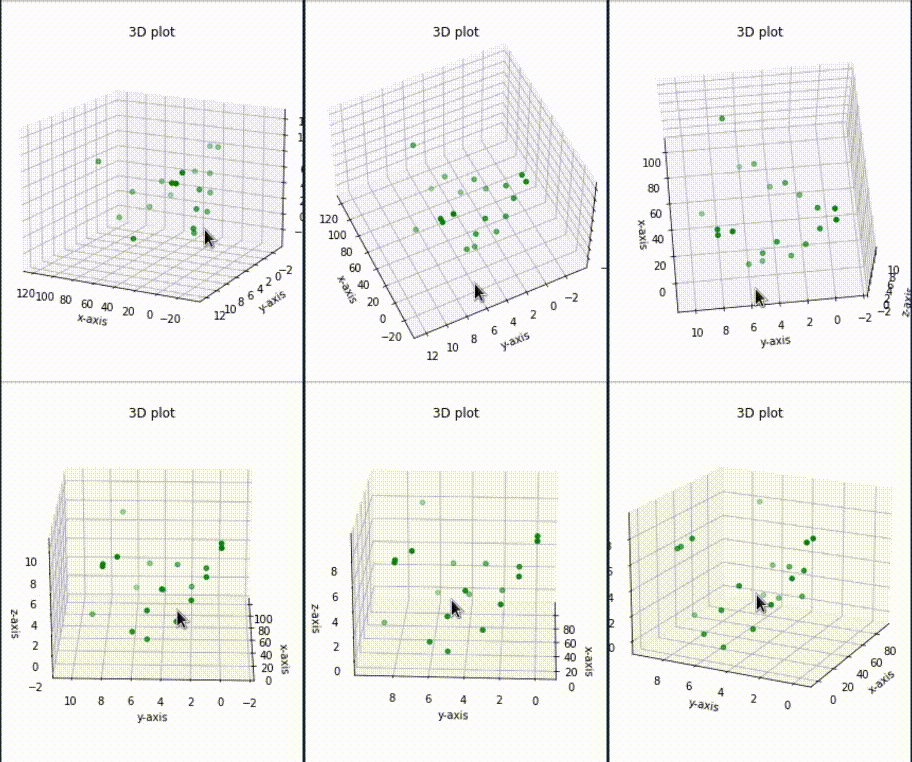
示例:交互式散点图
Python3
# creating 3d plot using matplotlib
# in python

# for creating a responsive plot
%matplotlib widget

# importing required libraries
from mpl_toolkits.mplot3d import Axes3D
import matplotlib.pyplot as plt

# creating random dataset
xs = [14, 24, 43, 47, 54, 66, 74, 89, 12,
      44, 1, 2, 3, 4, 5, 9, 8, 7, 6, 5]

ys = [0, 1, 2, 3, 4, 5, 6, 7, 8, 9, 6, 3,
      5, 2, 4, 1, 8, 7, 0, 5]

zs = [9, 6, 3, 5, 2, 4, 1, 8, 7, 0, 1, 2,
      3, 4, 5, 6, 7, 8, 9, 0]

# creating figure
fig = plt.figure()
ax = Axes3D(fig)

# creating the plot
plot_geeks = ax.scatter(xs, ys, zs, color='green')

# setting title and labels
ax.set_title("3D plot")
ax.set_xlabel('x-axis')
ax.set_ylabel('y-axis')
ax.set_zlabel('z-axis')

# displaying the plot
plt.show()
Python
# creating 3d bar plot using matplotlib
# in python

# to interacte  with plot
%matplotlib widget

# importing required libraries
from mpl_toolkits.mplot3d import Axes3D
import matplotlib.pyplot as plt
import numpy as np

# creating random dataset
xs = [2, 3, 4, 5, 1, 6, 2, 1, 7, 2]
ys = [1, 2, 3, 4, 5, 6, 7, 8, 9, 10]
zs = np.zeros(10)
dx = np.ones(10)
dy = np.ones(10)
dz = [1, 2, 3, 4, 5, 6, 7, 8, 9, 10]

# creating figure
figg = plt.figure()
ax = figg.add_subplot(111, projection='3d')

# creating the plot
plot_geeks = ax.bar3d(xs, ys, zs, dx,
                      dy, dz, color='green')

# setting title and labels
ax.set_title("3D bar plot")
ax.set_xlabel('x-axis')
ax.set_ylabel('y-axis')
ax.set_zlabel('z-axis')

# displaying the plot
plt.show()
输出:

Jupyter notebook 中的交互式 3D 绘图
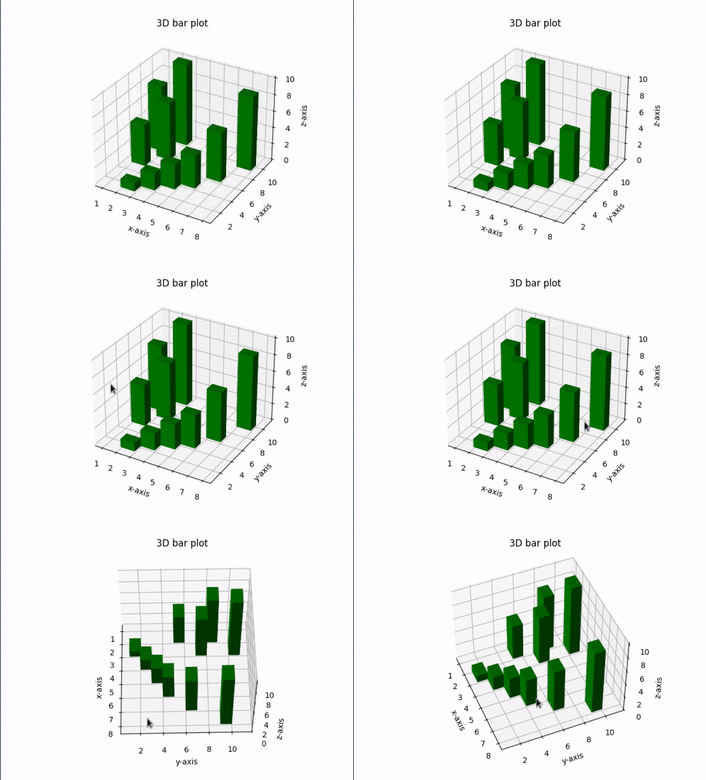
示例:交互式条形图
Python
# creating 3d bar plot using matplotlib
# in python

# to interacte  with plot
%matplotlib widget

# importing required libraries
from mpl_toolkits.mplot3d import Axes3D
import matplotlib.pyplot as plt
import numpy as np

# creating random dataset
xs = [2, 3, 4, 5, 1, 6, 2, 1, 7, 2]
ys = [1, 2, 3, 4, 5, 6, 7, 8, 9, 10]
zs = np.zeros(10)
dx = np.ones(10)
dy = np.ones(10)
dz = [1, 2, 3, 4, 5, 6, 7, 8, 9, 10]

# creating figure
figg = plt.figure()
ax = figg.add_subplot(111, projection='3d')

# creating the plot
plot_geeks = ax.bar3d(xs, ys, zs, dx,
                      dy, dz, color='green')

# setting title and labels
ax.set_title("3D bar plot")
ax.set_xlabel('x-axis')
ax.set_ylabel('y-axis')
ax.set_zlabel('z-axis')

# displaying the plot
plt.show()
输出:

交互式 3D 绘图